Python performance monitoring for Django, Flask, Celery, and more
Here's some excellent news for the Pythonistas in the room: You can now monitor the performance of your Python applications with Honeybadger.
Last year, we launched Honeybadger Insights, a new logging and observability tool bundled with Honeybadger. Insights enables you to query your application logs and events to answer performance questions, perform root-cause analyses, and create charts and dashboards to see what's happening in real time. It's also deeply integrated with error tracking, unlocking direct access to query and analyze your error data.
Today, we're taking Python monitoring to the next level with automatic performance instrumentation and pre-built dashboards for Django, Flask, and Celery. Now you can get comprehensive observability and performance insights out of the box in Honeybadger.
Python performance monitoring in Honeybadger
Here's what's new for Python developers:
-
A new Django monitoring dashboard. Instead of building dashboards from scratch, just select "Django" from our list of automatic monitoring dashboards. The dashboard gives you instant visibility into request performance, slow views, Django ORM queries, and more—everything you need to optimize your Django applications.
-
A new Flask monitoring dashboard. We've built comprehensive Flask monitoring that tracks routes, blueprint-level insights, and SQLAlchemy query performance. Whether you're running a simple Flask app or a complex multi-blueprint application, this dashboard has you covered.
-
A new Celery monitoring dashboard. Background job monitoring is crucial for Python applications, so we created a dedicated Celery dashboard that tracks job health, worker performance, and helps you identify slow tasks before they become problems.
-
Automatic performance instrumentation for Python frameworks. Our Python package now automatically sends performance events and telemetry from Django, Flask, FastAPI, and Celery. The new instrumentation powers your dashboards, but you can also use Insights and BadgerQL to dive into the data yourself, which creates some exciting possibilities for custom analysis.
Before we dive into each of these features, here's the tl;dr:
You can try Honeybadger for free right now with 50MB/day ingest included—that's 1.5GB/month for free, plus error tracking, uptime monitoring, and status pages. Our team pricing is also reasonable; Honeybadger is four times cheaper than Papertrail for logging. 🤯
If you already use Honeybadger for Python, upgrade your honeybadger package to version 1.1 or later, then enable Insights with a single configuration flag to start sending data to your automatic dashboards.
Meet your Python performance dashboards
When creating a dashboard in Honeybadger, you now have several Python-specific options. To get started, select the new "Django," "Flask," or "Celery" dashboard from the list:
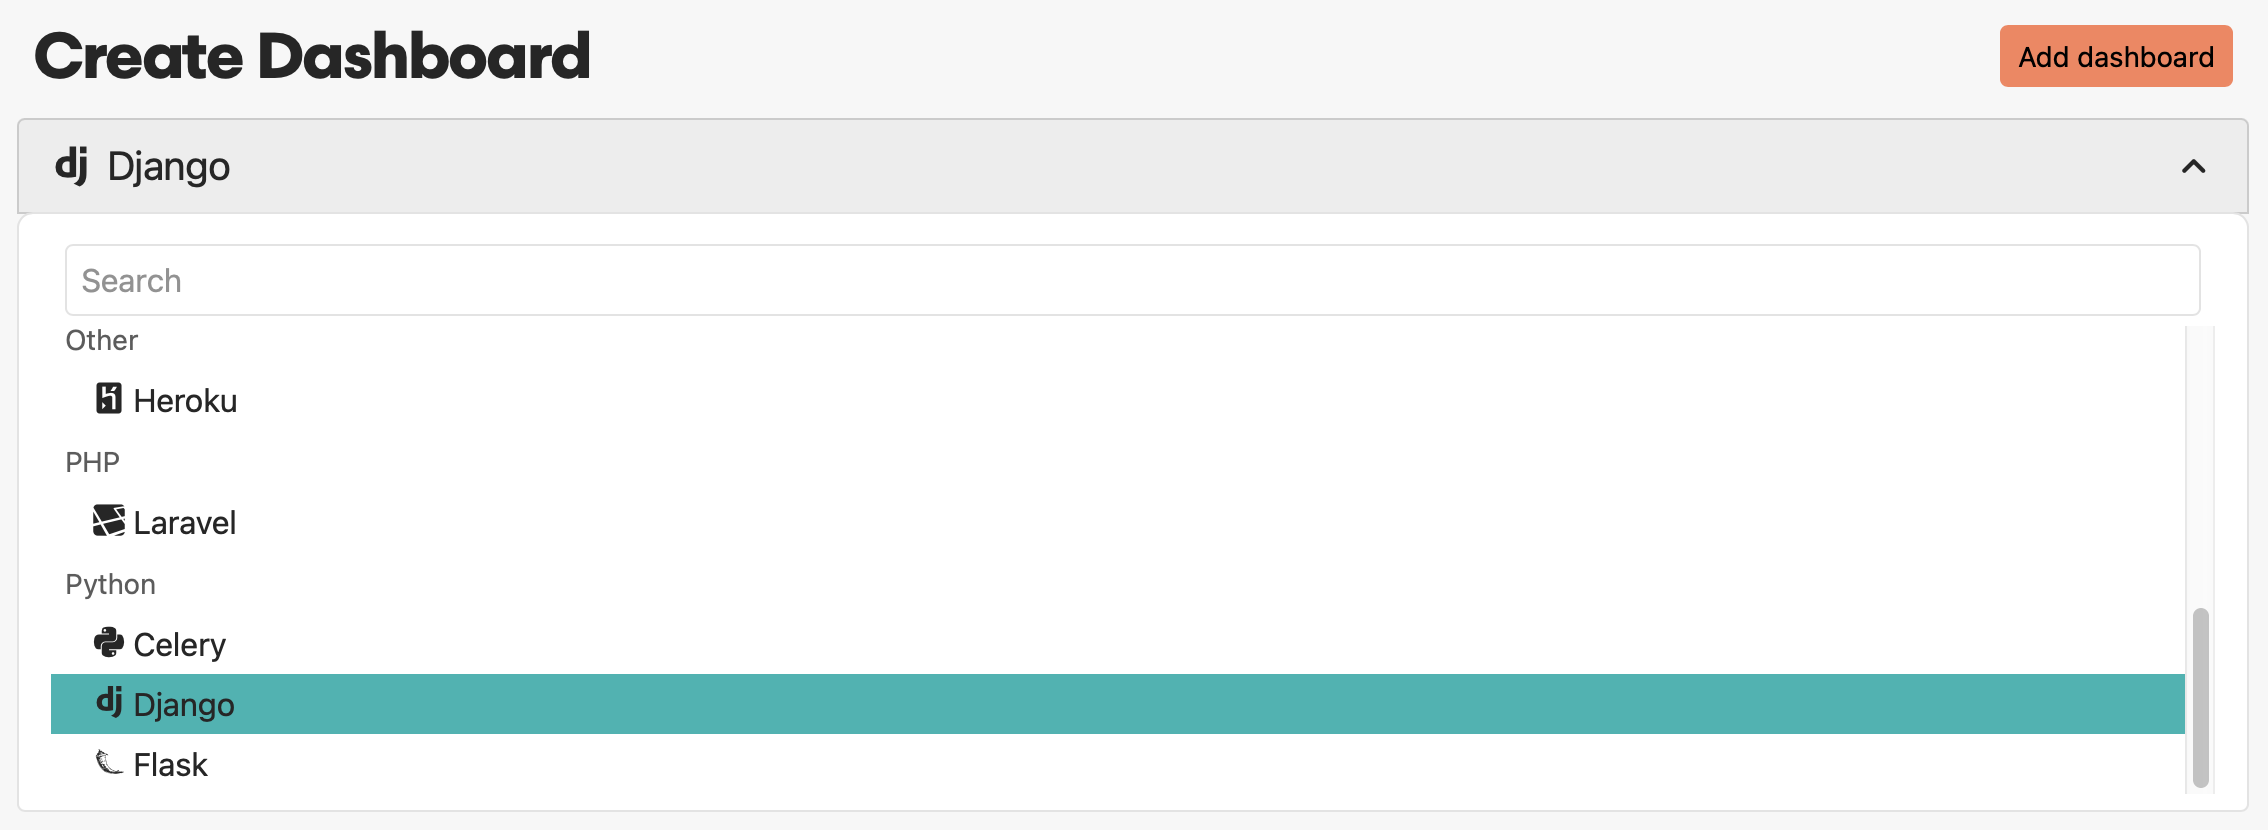
Our team curates each dashboard to make it easy for you to ramp up with Honeybadger and BadgerQL. Simply install our latest Python package, select your dashboard(s), and you're all set.
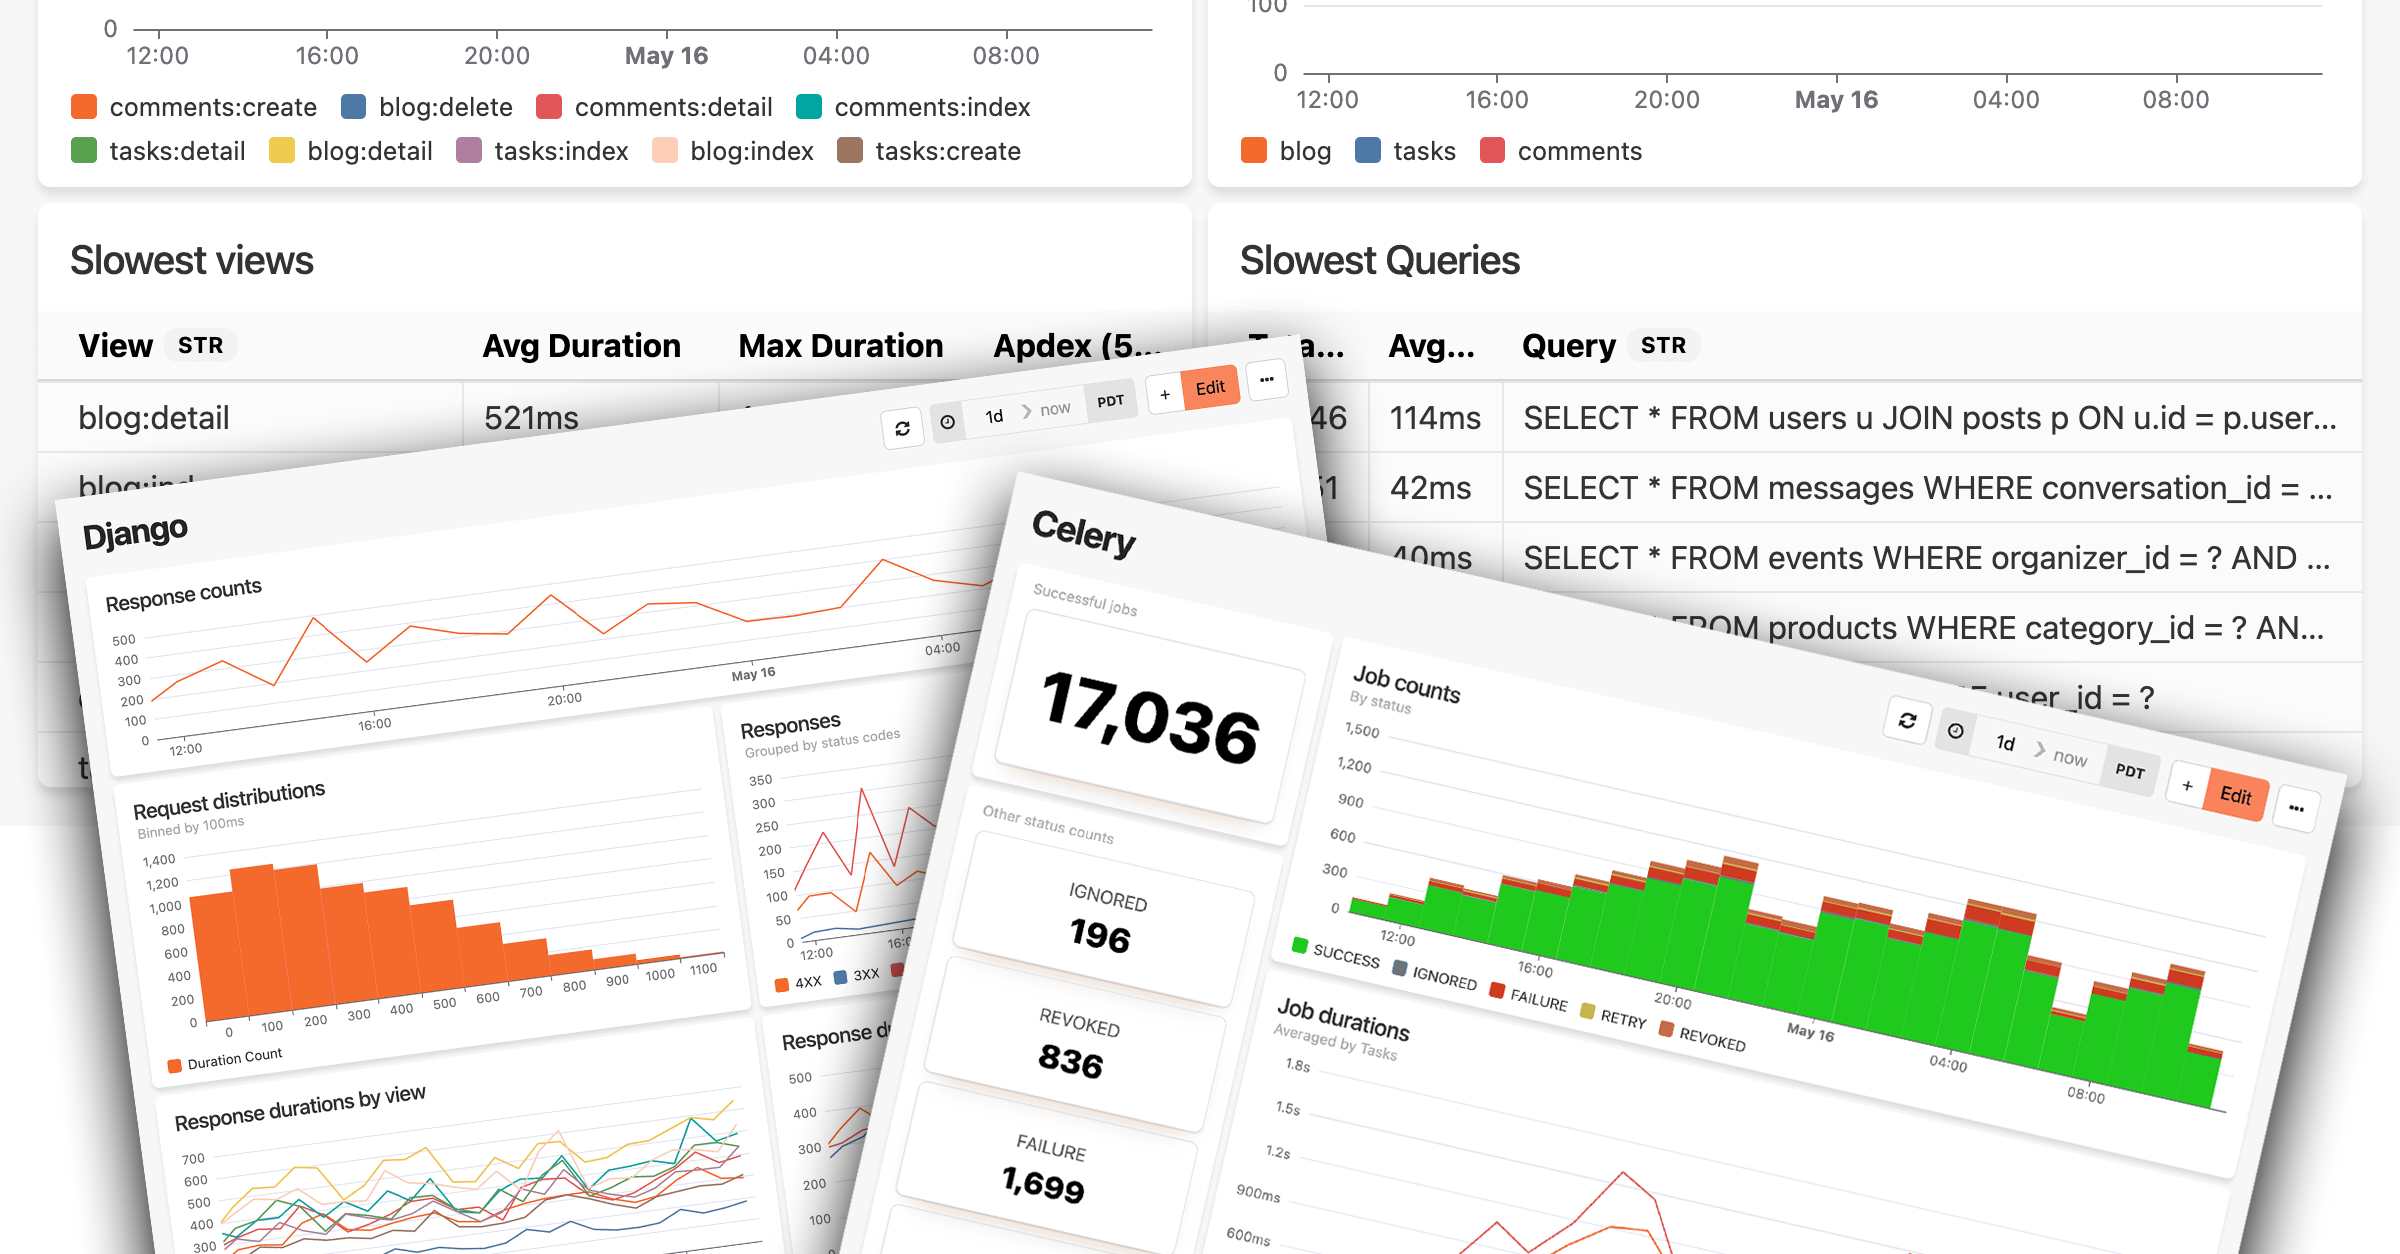
Django performance dashboard
Honeybadger’s automatic Django dashboard gives you instant visibility into your application's performance, helping you spot bottlenecks, track down slow queries, and optimize the endpoints that matter most to your users.
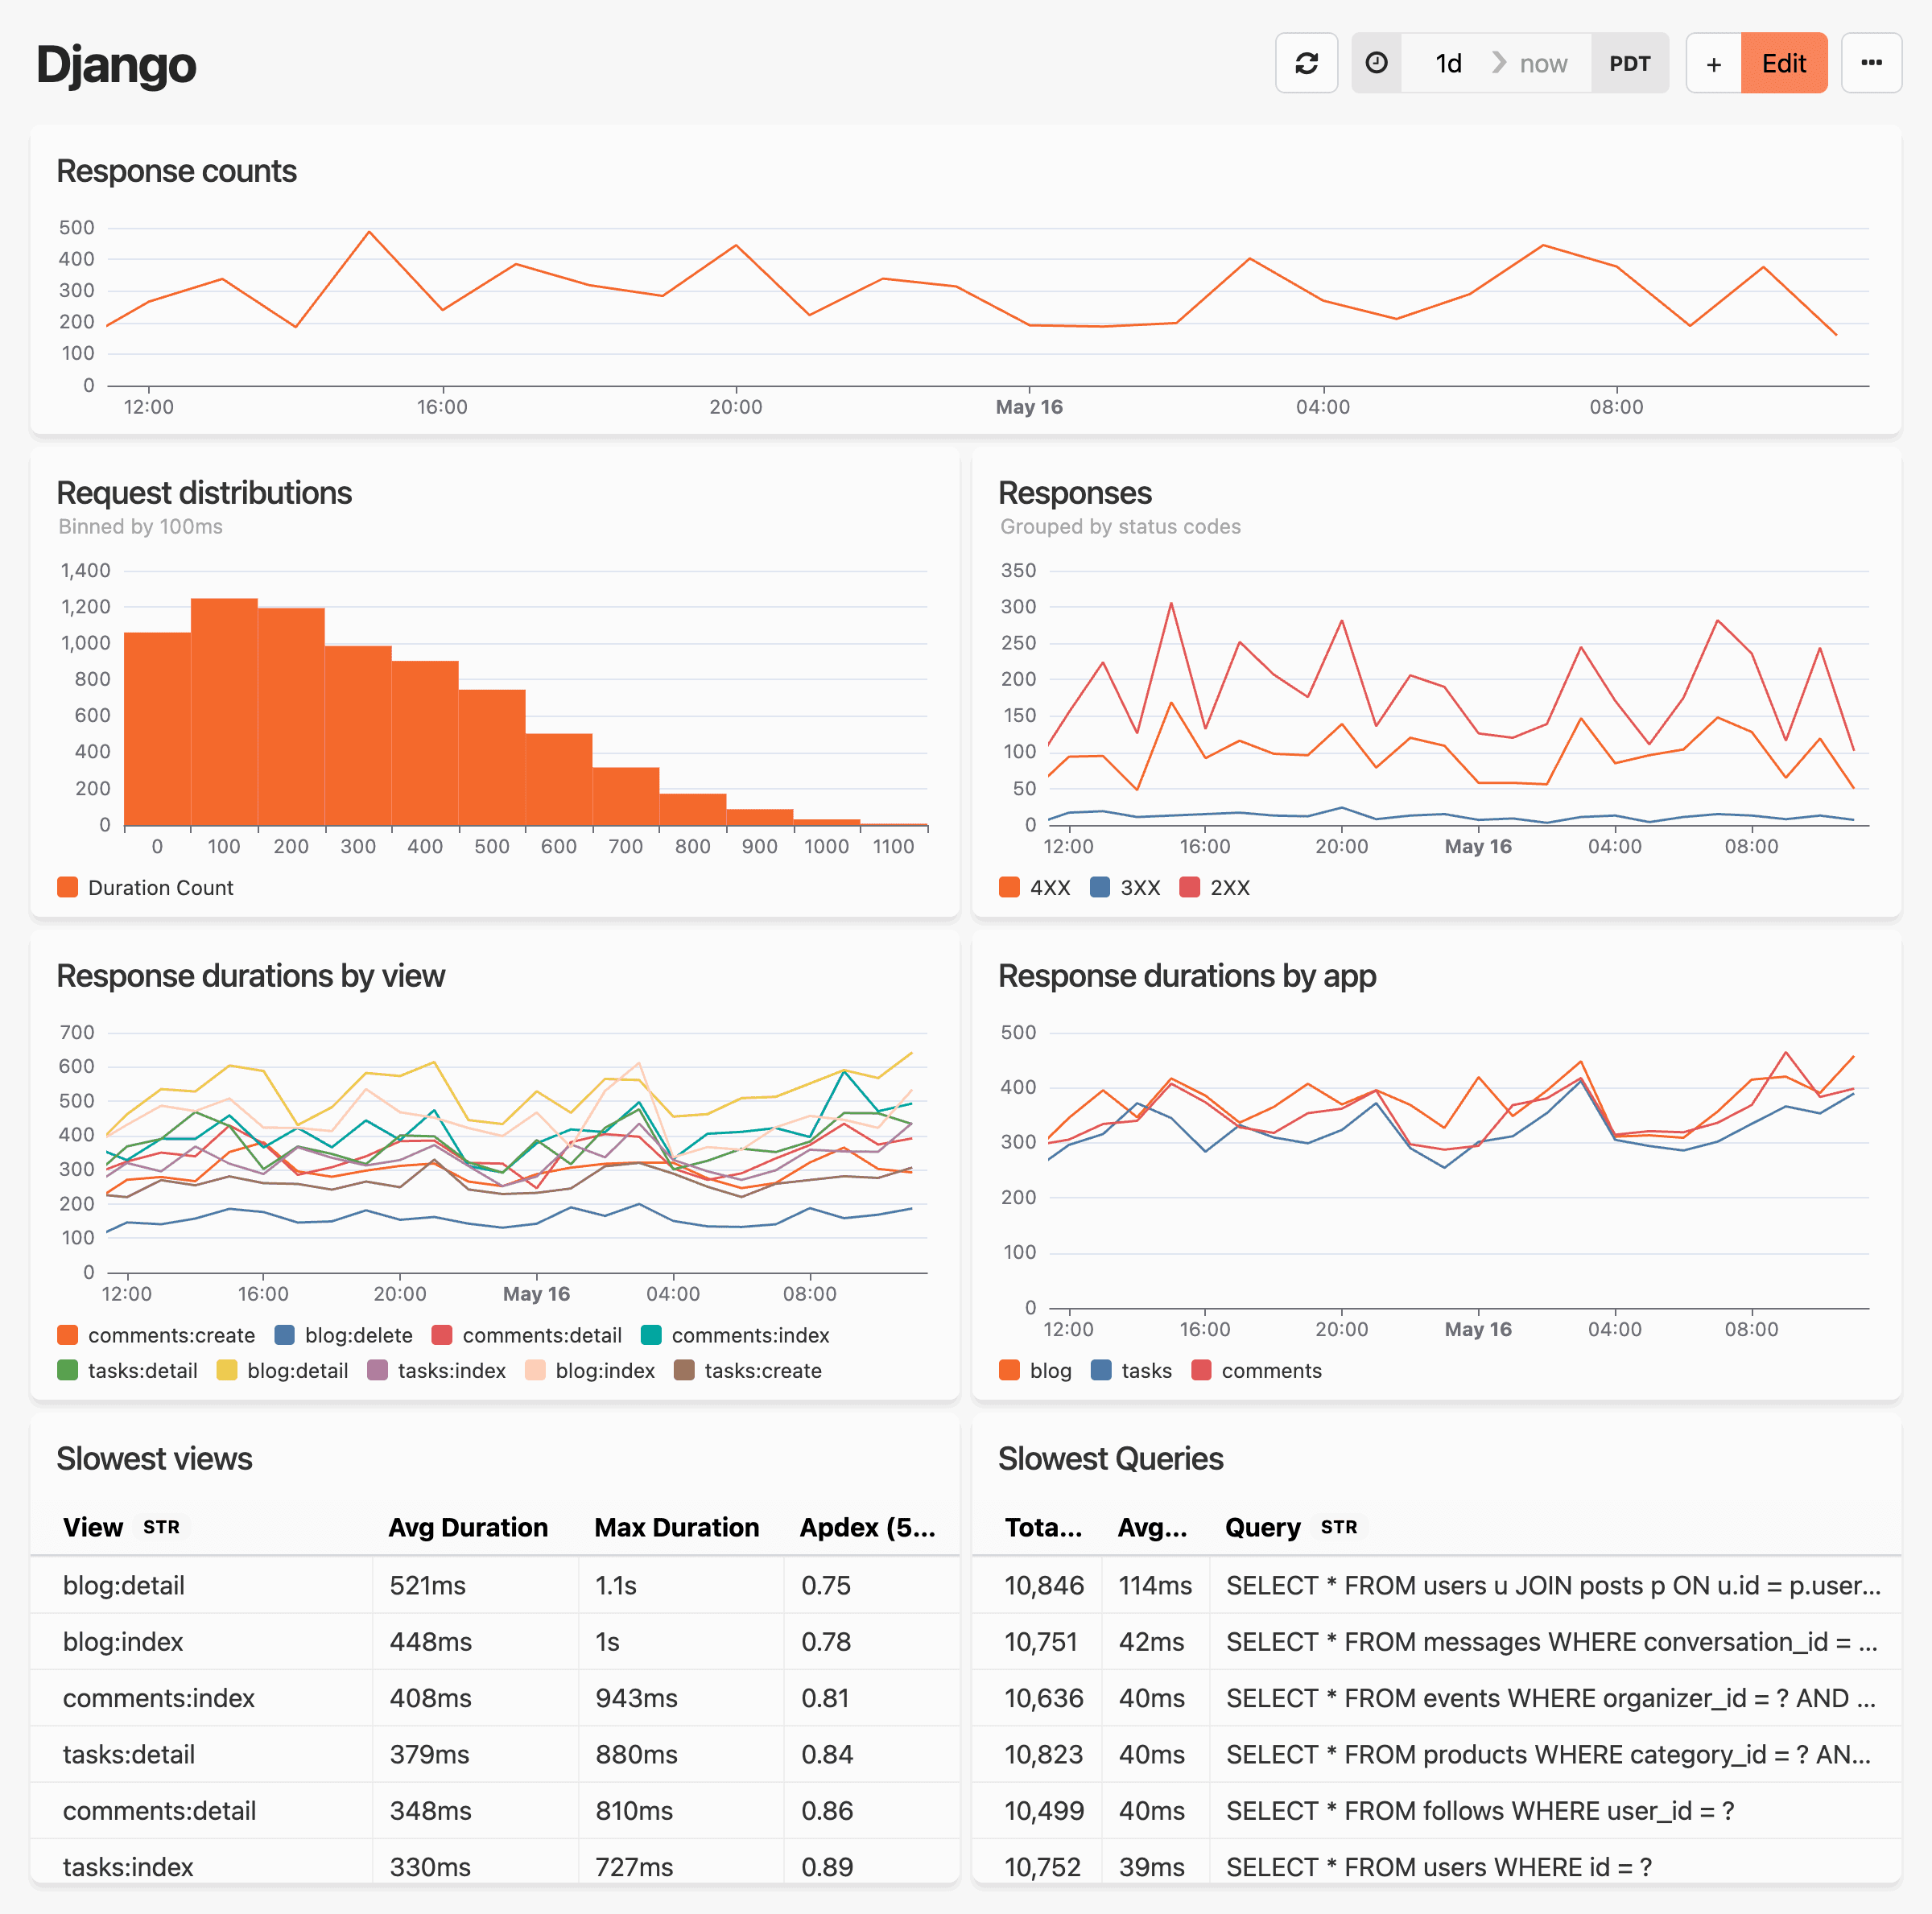
The new Django dashboard includes the following widgets by default:
- Response counts - A line chart showing request volume over time, so you know immediately when you have traffic spikes or unusual patterns.
- Request distributions - A histogram of response times binned by duration (100ms intervals), showing how the majority of your requests are performing.
- Responses - A multi-line chart showing response counts by status code (4XX, 3XX, 2XX) over time, making it easy to spot error spikes.
- Response durations by view - Multi-line chart tracking performance by Django view/controller, helping you identify which views need optimization.
- Response durations by app - Performance breakdown by Django application, useful for larger projects with multiple apps.
- Slowest views - Table showing your worst-performing views with average duration, max duration, and Apdex scores. This points you directly to where you can improve performance.
- Slowest queries - Database queries with performance metrics and full SQL, automatically captured from Django ORM operations.
The automatic Django ORM query tracking is particularly powerful—you get deep visibility into your database performance without any additional configuration.
Flask performance dashboard
Our automatic Flask dashboard gives you complete visibility into your application's performance, helping you identify slow routes, monitor blueprint-level trends, and optimize database queries for a better user experience.
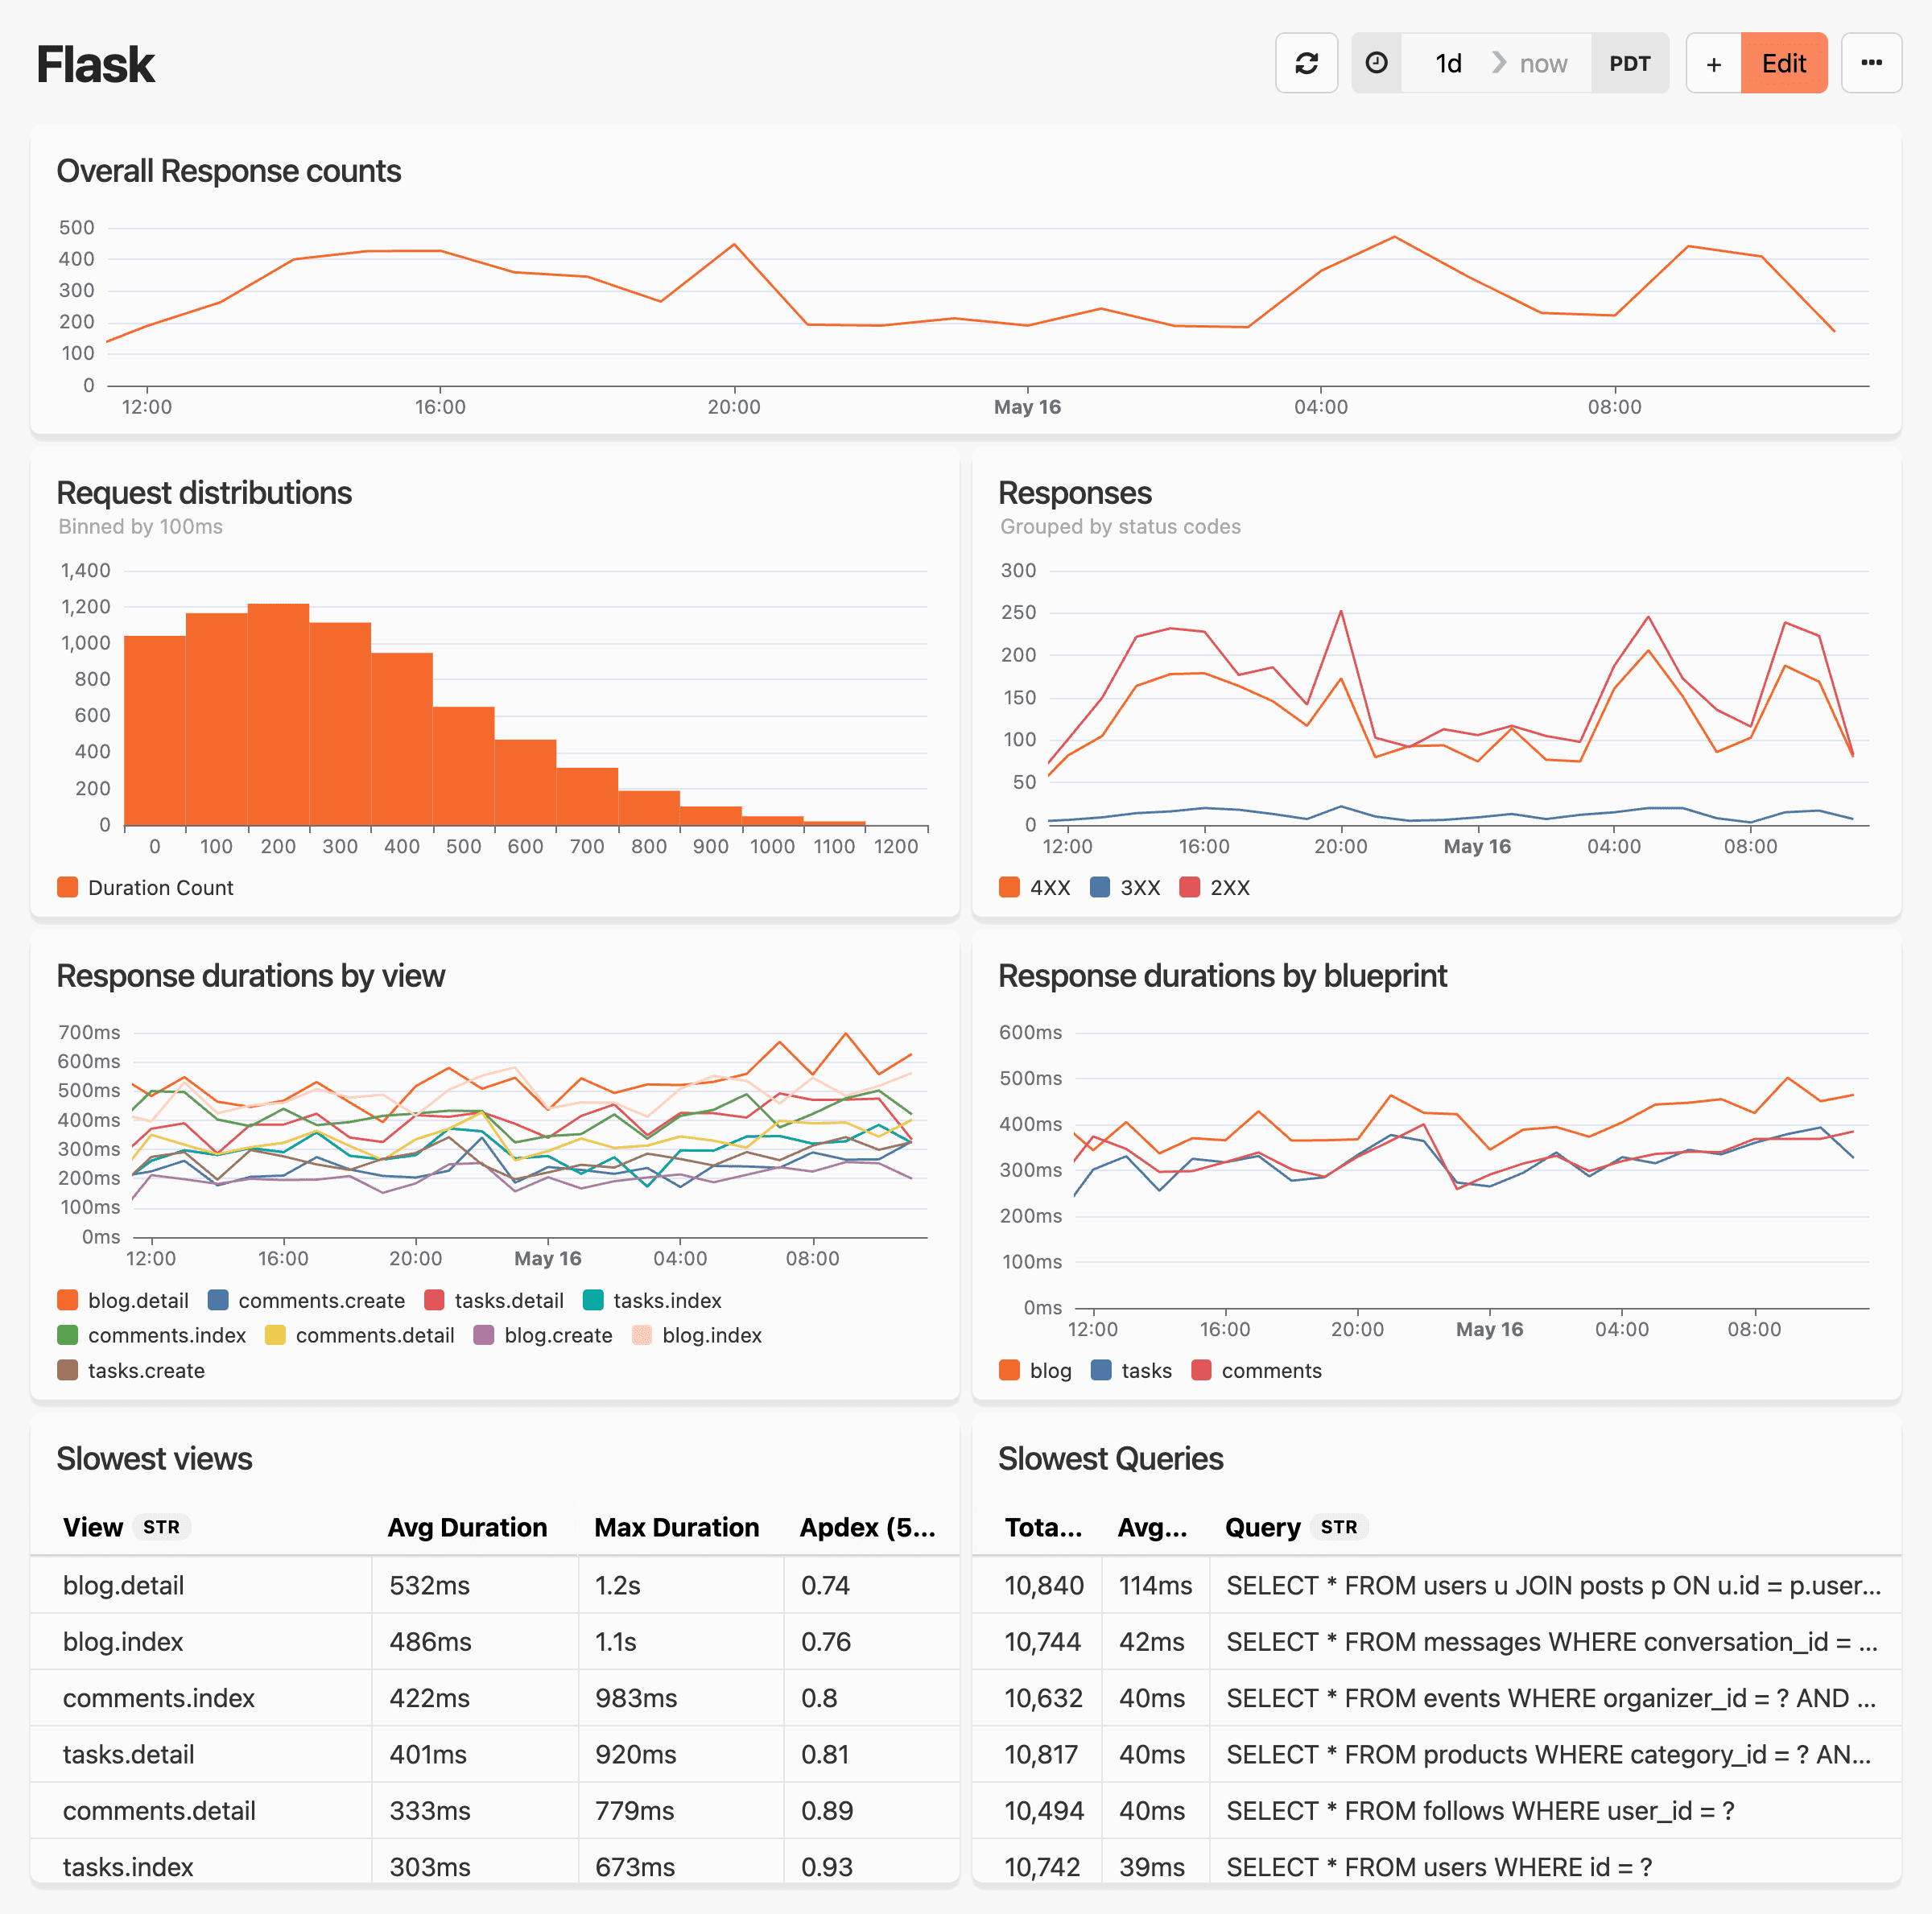
The Flask dashboard includes these default widgets:
- Overall Response counts - Request volume trending over time for your Flask application.
- Request distributions - Response time histogram showing the distribution of your application's performance.
- Responses - Status code breakdown (4XX, 3XX, 2XX) over time to quickly identify error patterns.
- Response durations by view - Performance tracking by Flask route/endpoint, helping you optimize slow endpoints.
- Response durations by blueprint - Blueprint-level performance insights for better application organization.
- Slowest views - Table highlighting your poorest performing routes with duration metrics and Apdex scores.
- Slowest queries - Database query performance with automatic SQLAlchemy integration.
The Flask integration provides automatic SQLAlchemy query monitoring and blueprint-level insights, giving you comprehensive visibility into the performance of your Flask application.
Celery performance dashboard
HB’s automatic Celery dashboard gives you real-time visibility into your background job processing, helping you track queue health, identify slow tasks, and ensure your workers are performing optimally.
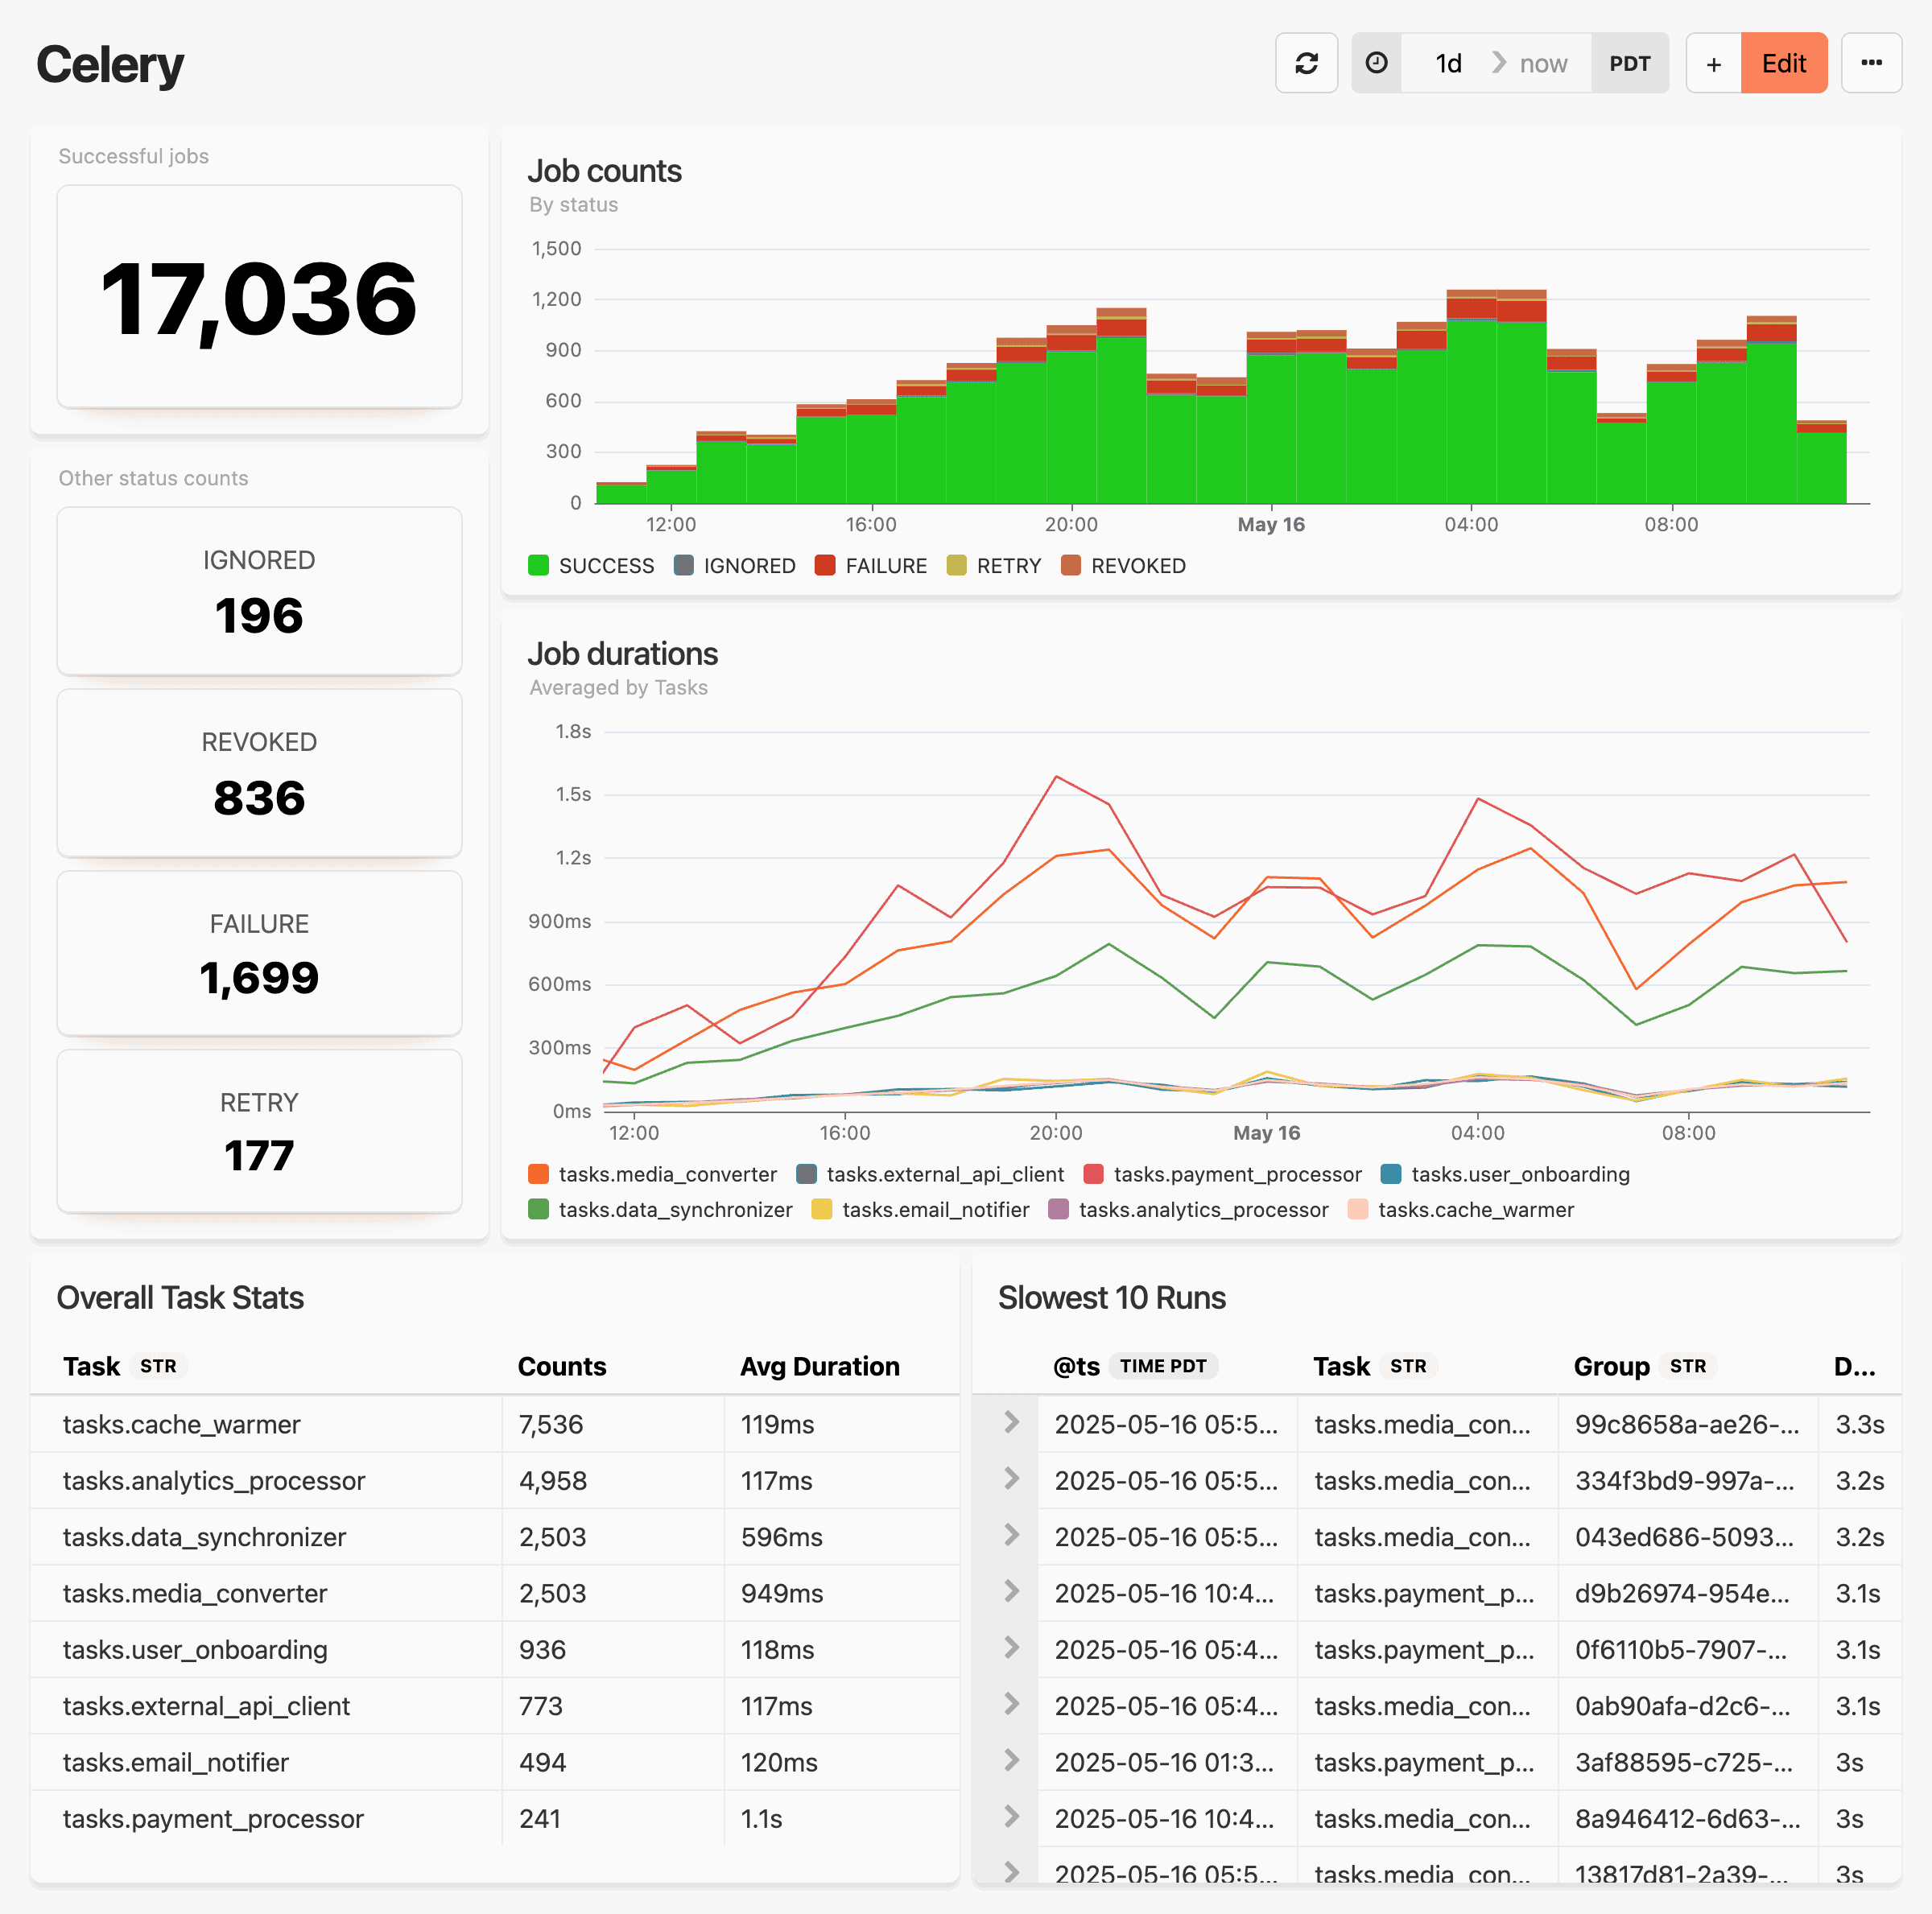
The Celery dashboard includes:
- Successful jobs - Large counter showing total completed tasks, giving you an immediate health check.
- Job counts by status - Stacked area chart showing the distribution of job states (SUCCESS, IGNORED, FAILURE, RETRY, REVOKED) over time.
- Job durations - Multi-line chart showing average execution time by task type over time, helping you identify performance trends.
- Overall Task Stats - Table with task counts and average durations by worker module.
- Slowest 10 Runs - Table of individual slow task executions with timestamps and durations for detailed investigation.
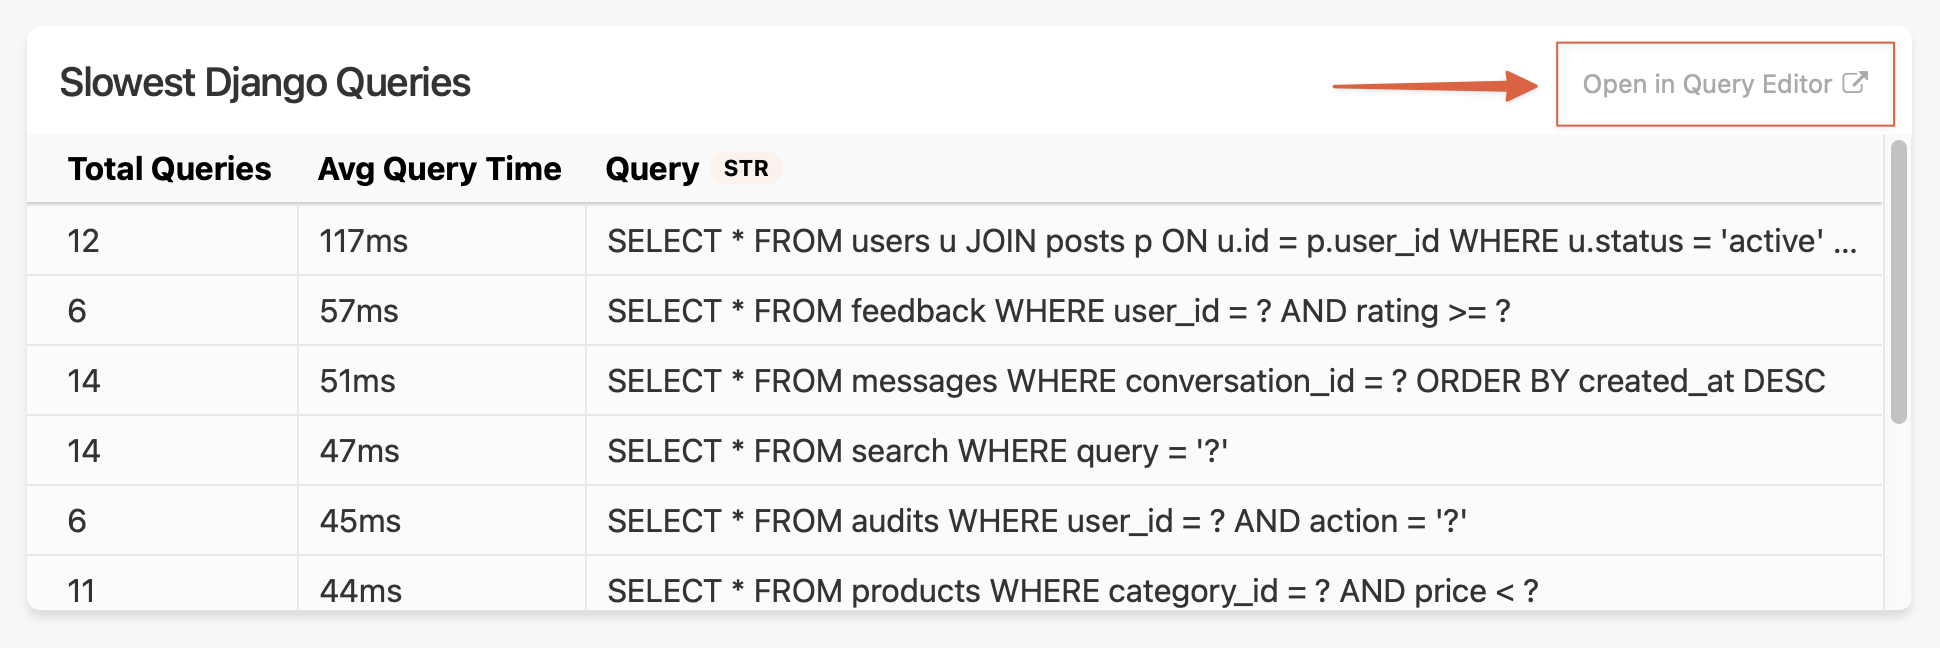
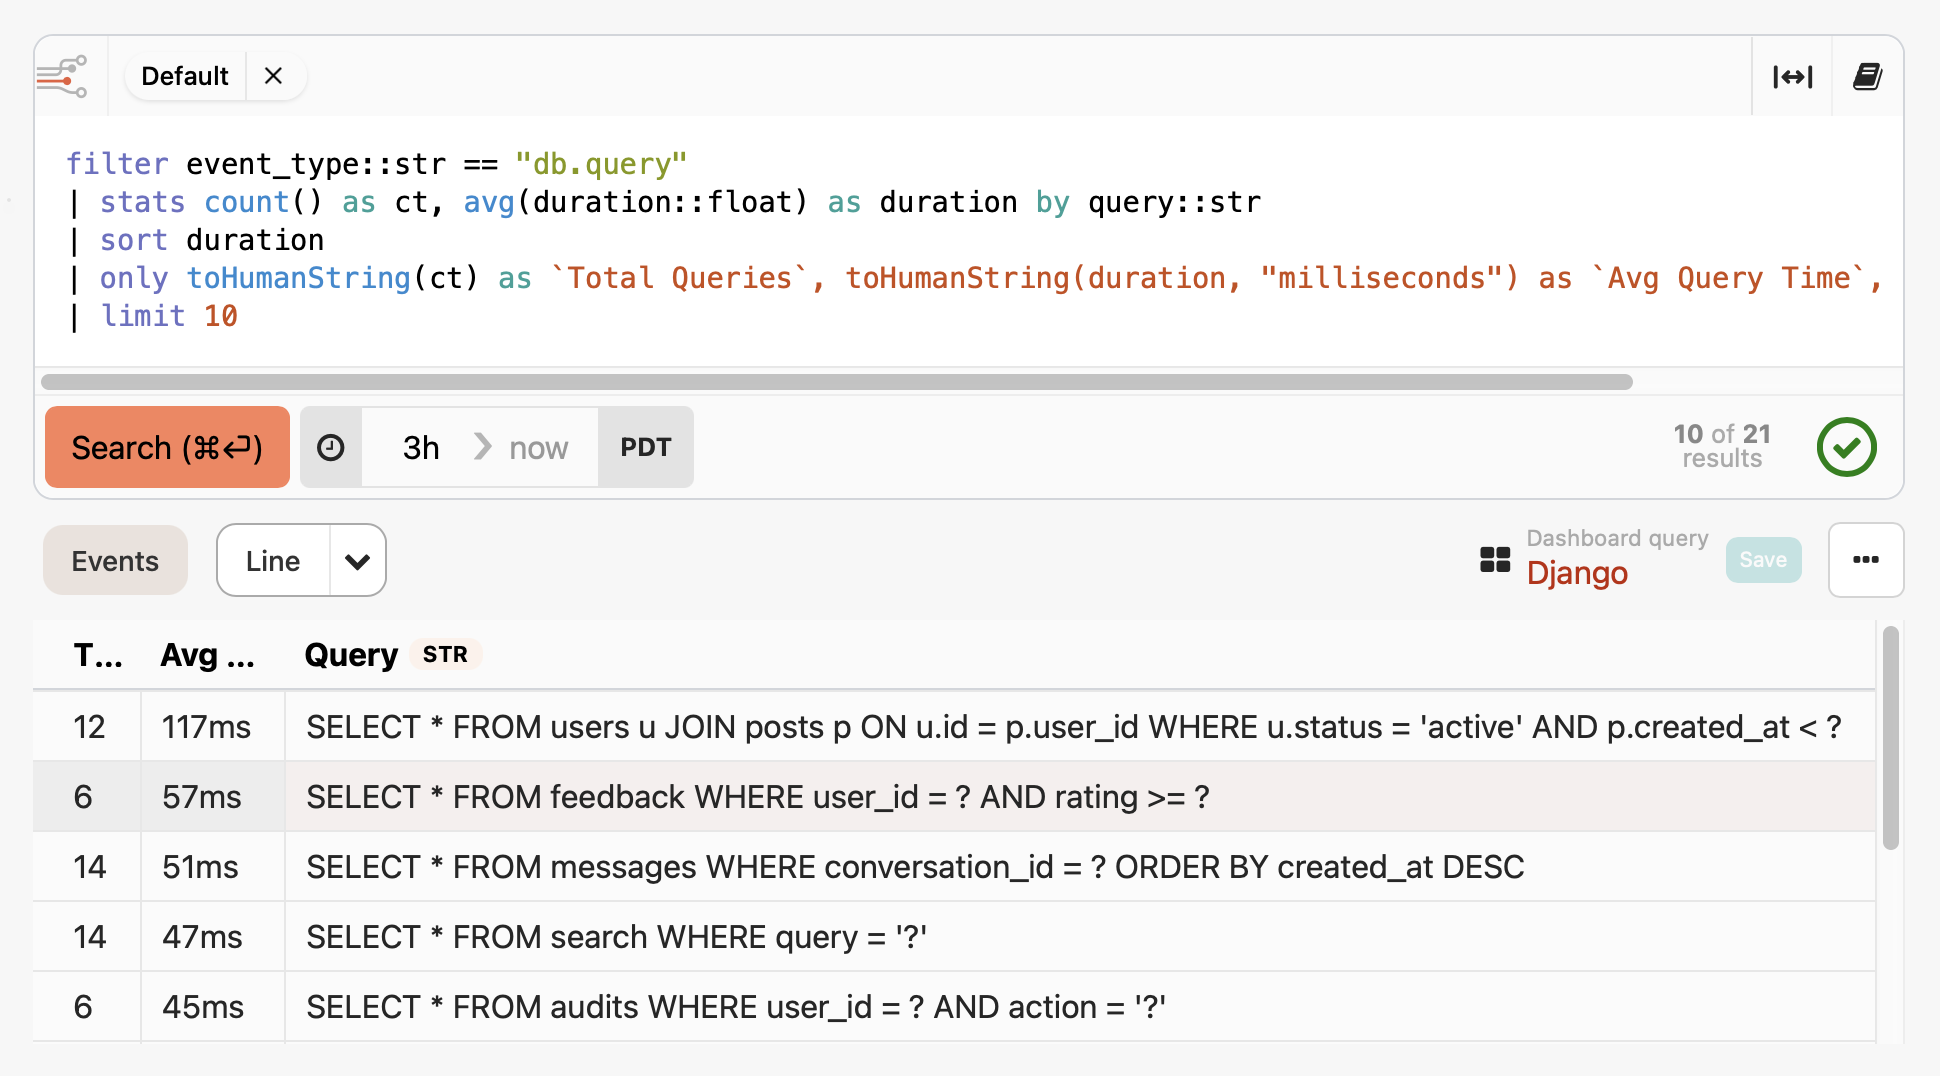
After you create a dashboard, you don't have to keep the default widgets—we designed Honeybadger dashboards to be customized. Reading the underlying queries is a great way to learn BadgerQL. To see the query and raw data behind any dashboard widget, click "Open in Query Editor":
You can tweak the query, review the results, and update the dashboard from there:
Python performance instrumentation
The data that feeds these new dashboards is sent automatically from the honeybadger Python package starting in version 1.1—so make sure you upgrade to the latest version. To enable Honeybadger's automatic instrumentation, add the following to your configuration:
honeybadger.configure(insights_enabled=True)
You can alternatively enable insights in your framework config for Django or Flask:
# Django config
HONEYBADGER = {
		# ...
    'INSIGHTS_ENABLED': True,
}

# Flask config
app = Flask(__name__)
# ...
app.config['HONEYBADGER_INSIGHTS_ENABLED'] = True
If you're installing Honeybadger for the first time, check out our integration guides for complete setup instructions:
After deploying your application, new events and metrics will start appearing in Honeybadger Insights, and your dashboards will come to life!
Supported frameworks & libraries
Honeybadger automatically instruments these Python frameworks and libraries when you enable Insights:
| Framework | Event Types Captured | Key Features |
|---|---|---|
| Django | django.request, db.query |
HTTP requests, Django ORM queries, response time tracking |
| Flask | flask.request, db.query |
HTTP requests, SQLAlchemy queries, blueprint-level insights |
| ASGI | asgi.request |
Generic ASGI applications (FastAPI, Starlette, etc.) |
| Celery | celery.task_finished |
Task execution, duration tracking, failure monitoring |
The instrumentation captures comprehensive telemetry including request details, database query performance, background job metrics, and response times—all with zero additional configuration.
You can fine-tune the instrumentation for specific frameworks using the insights_config parameter:
honeybadger.configure(
    insights_enabled=True,
    insights_config={
        "django": {
            "include_params": True,  # Include GET/POST params
        },
        "flask": {
            "include_params": True,
        },
        "celery": {
            "include_args": True,    # Include task arguments
            "exclude_tasks": ["internal_cleanup"],
        },
        "db": {
            "include_params": False, # SQL parameter values
            "exclude_queries": [     # Skip common system queries
                "PRAGMA",
                "SHOW ",
            ],
        }
    }
)
Sending custom events
You can also send your own custom events to Honeybadger using the honeybadger.event method:
honeybadger.event('user.signed_up', {
    'user_id': user.id,
    'plan': 'premium'
})
The first argument is the type of the event (event_type), and the second argument is a dictionary containing any additional data you want to include.
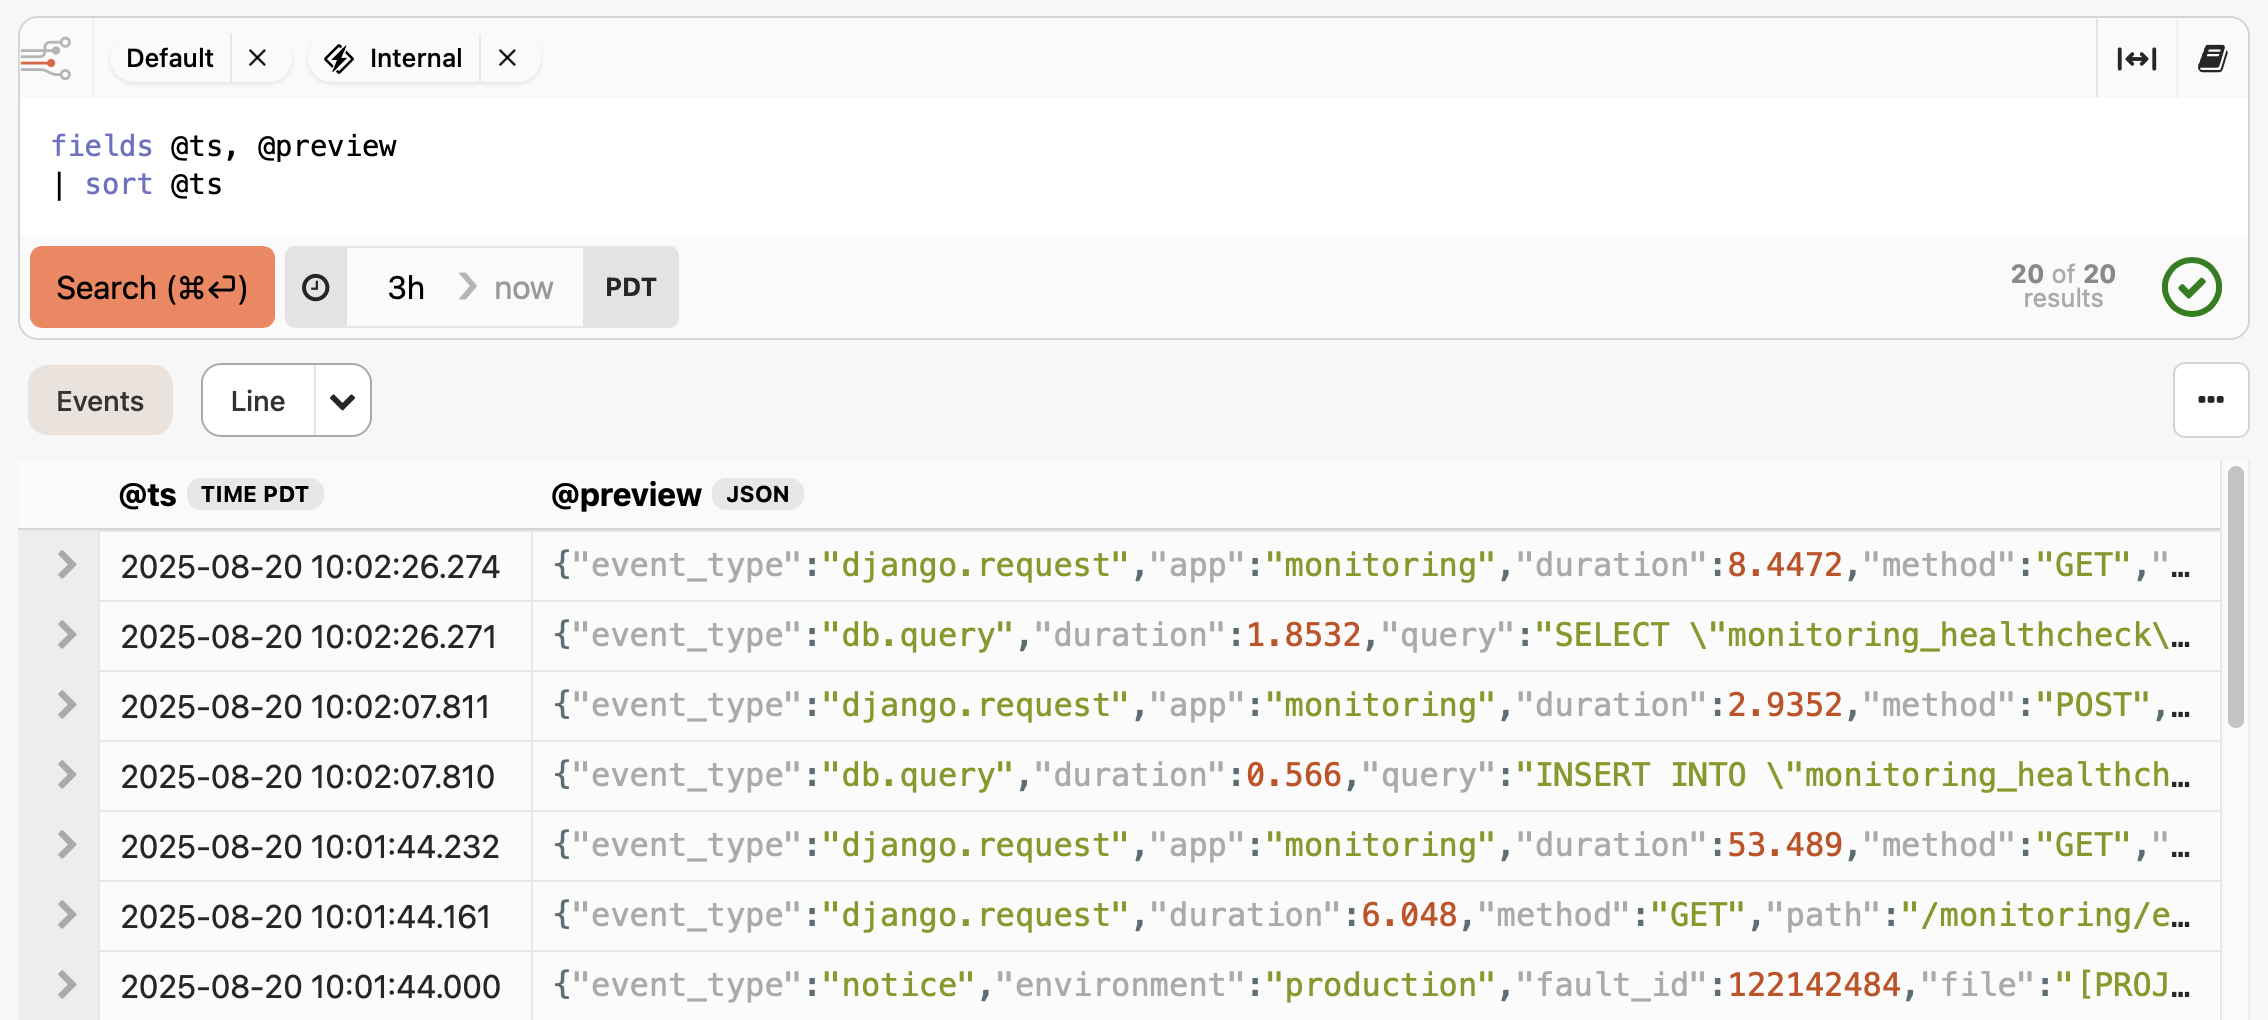
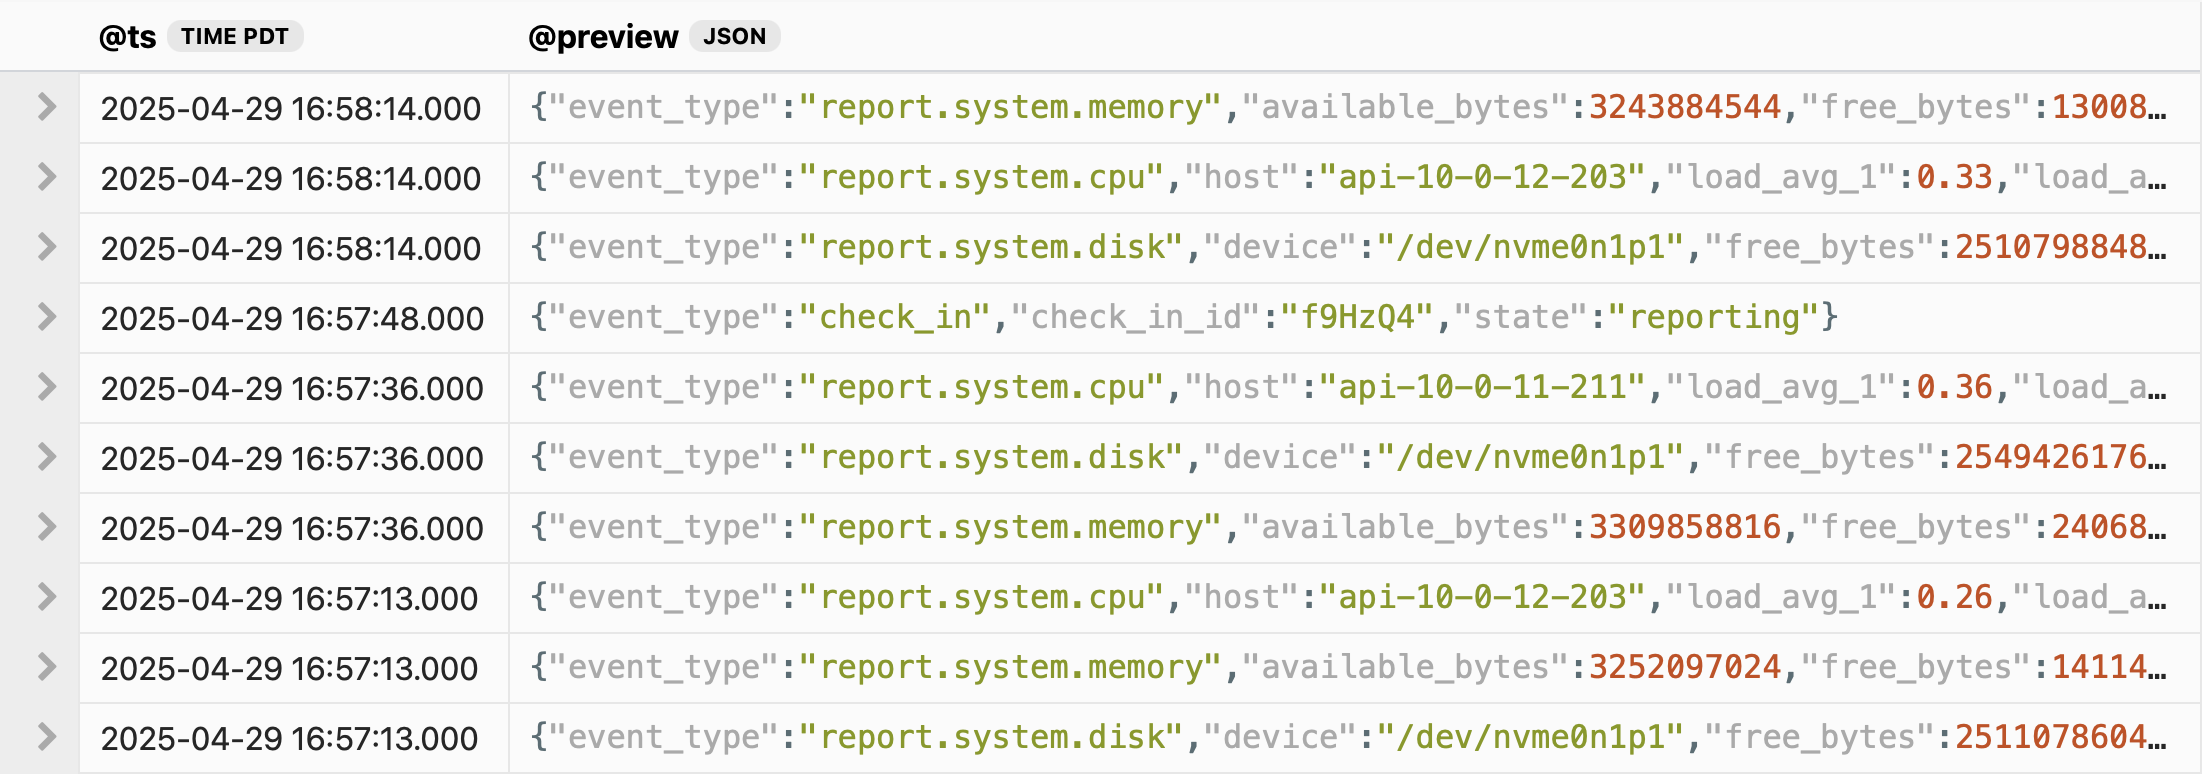
You can find these events with the following BadgerQL query:
fields @ts, @preview
| filter event_type::str == "user.signed_up"
| sort @ts
You can also add custom metadata to all events sent from your application using event context, and for advanced use cases, you can filter and transform events before they're sent to Honeybadger.
Sending logs from your infrastructure
Last but not least, Honeybadger isn't just for errors and application data! You can use our syslog, Vector, or PaaS integrations to send additional data from your infrastructure to Honeybadger, where you can query, visualize, and analyze all of your production data in one place.
Start monitoring your Python performance
To try out the new Python performance monitoring features in Honeybadger, all you need to do is sign up for a free Honeybadger account. We include 50MB/day (1.5GB/month) ingest for free, plus error tracking, uptime monitoring, and status pages. Our pricing is reasonable, too: Honeybadger is four times cheaper than Papertrail for logging.

Written by
Joshua WoodJosh started hacking on IRC scripts in the late nineties and has been hacking on computers (and businesses) ever since. As a co-founder of Honeybadger he works on the product, leads marketing and developer relations, and is involved in many open-source projects.