Introducing Honeybadger Insights
I'm pleased to announce a new feature that we've been building for over a year: Honeybadger Insights. Insights is our take on logging and performance monitoring, helping application developers gain deeper visibility into what's happening with their applications. It goes beyond application monitoring and responding to exceptions and downtime. Insights lets you drill down into the details and step back to see patterns in your data.
Before we dive in, here's the tl;dr:
- Insights comes pre-filled with your Honeybadger data, allowing you to query your errors, uptime checks, and check-ins with a simple query language called BadgerQL.
- Use BadgerQL to gain immediate insights into your application's health and performance, then send your application logs and events to gain even more visibility.
- You can try Insights right now when you sign up for a free Honeybadger account!
You can query your Honeybadger data
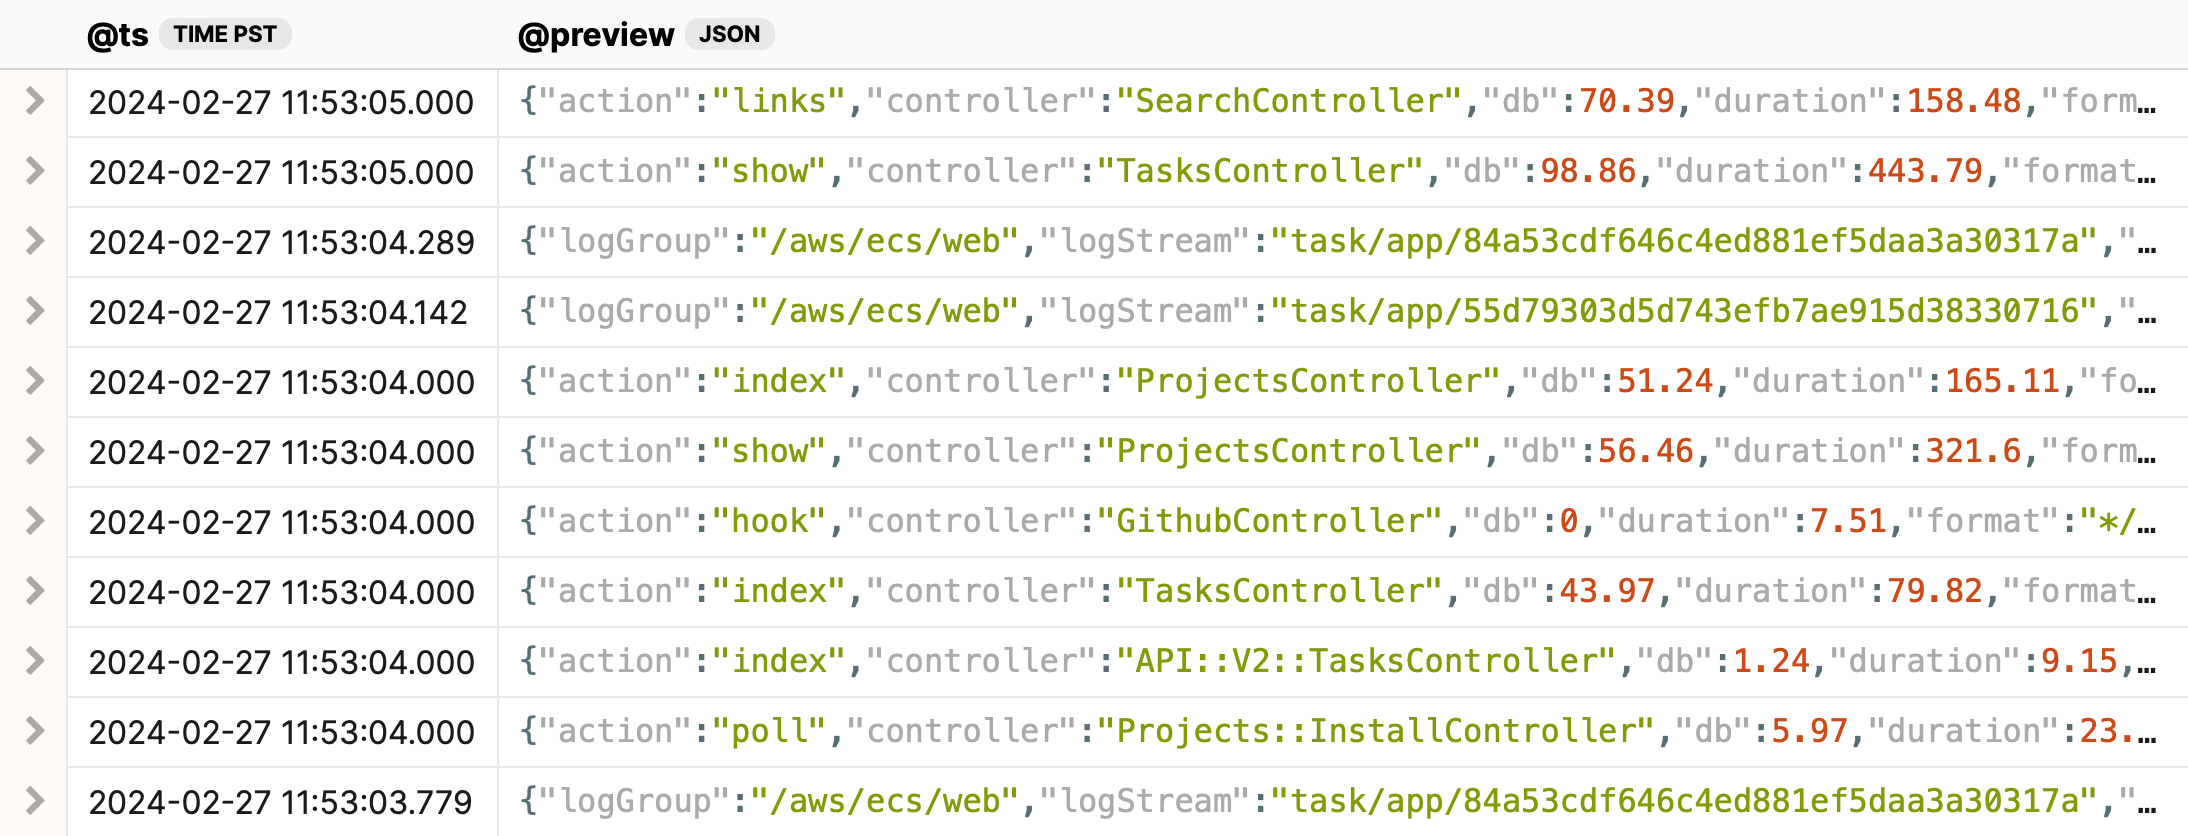
We're already sending all of the error, uptime, and check-in data to Insights, which we are capturing as part of our monitoring services, so you can slice and dice your data in any way you want.
Do you want to see all error reports affecting a particular user, browser, or combination of both? Would you like to know which browser versions were responsible for the most errors but only for a specific subdomain or route in your app? Or what times of day had the slowest response times for your uptime checks over the past week?
You can answer these questions and more with our new query language, BadgerQL. BadgerQL lets you dive into your Honeybadger data in new and fun ways that weren't previously possible.
Say Hello to BadgerQL
BadgerQL is a powerful query language that lets you quickly filter, transform, and aggregate your data. Here's an example of the default query that's similar to a SELECT * in SQL:
fields @ts, @preview
| sort @ts desc
The default query shows you all the events for a given timeframe, with the most recent events listed first and a preview of the data for each event.
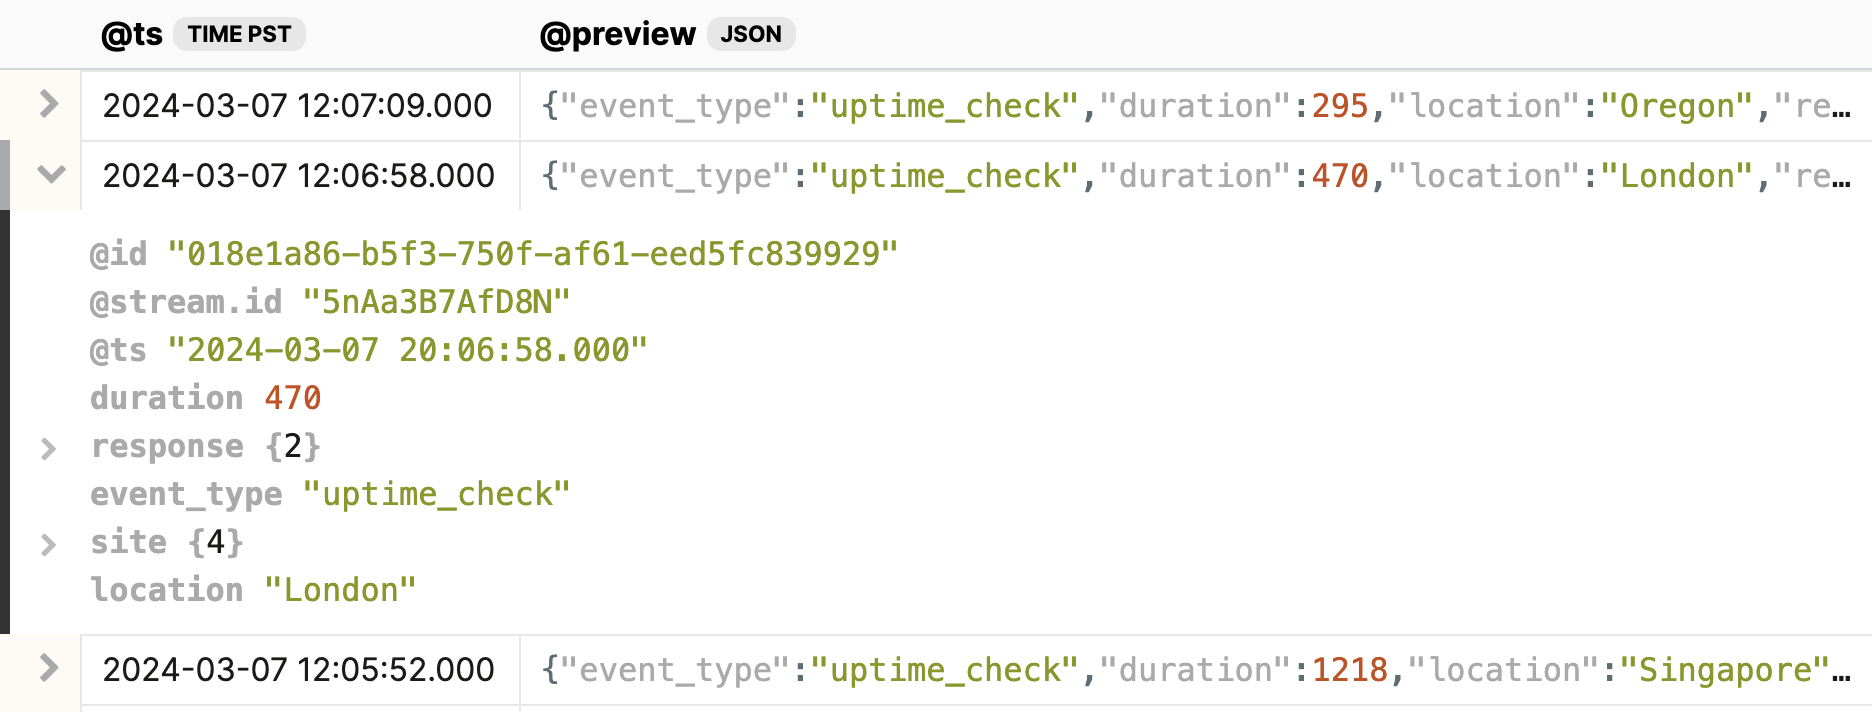
Clicking the disclosure control at the beginning of the row shows you all of the properties in the event. From there, you can narrow it down to just the information you need, like the average duration of uptime checks over time:
filter event_type::str == "uptime_check"
| stats avg(duration::int) by bin(4h)
From there, you can create a chart of the counts:
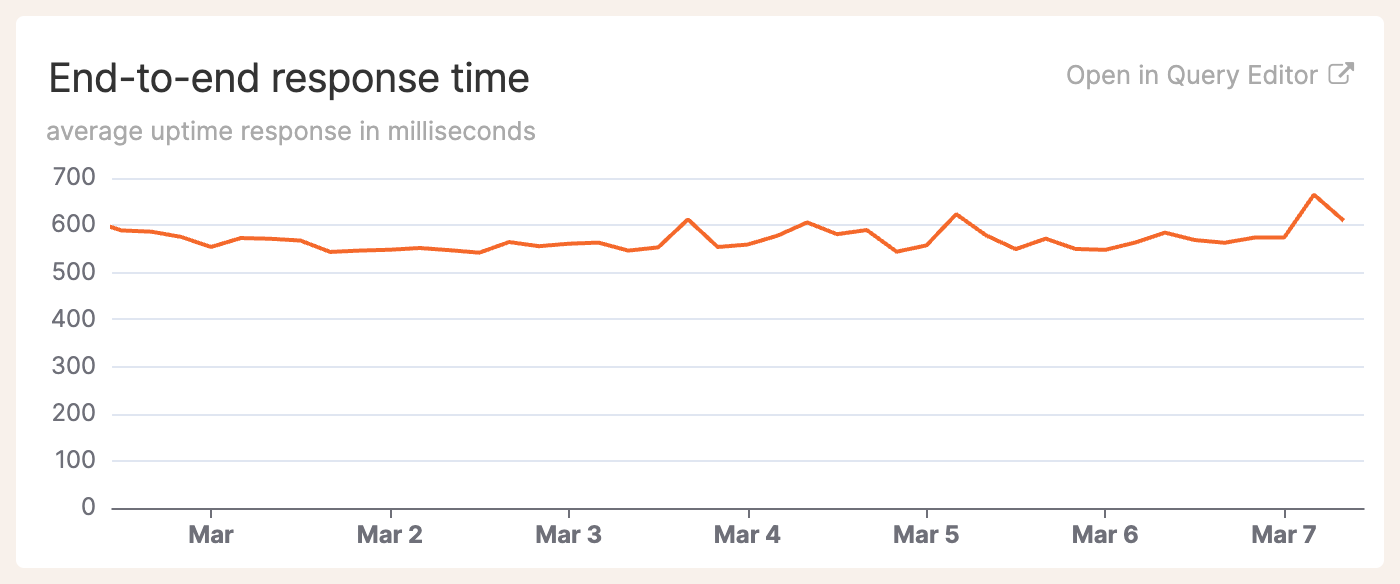
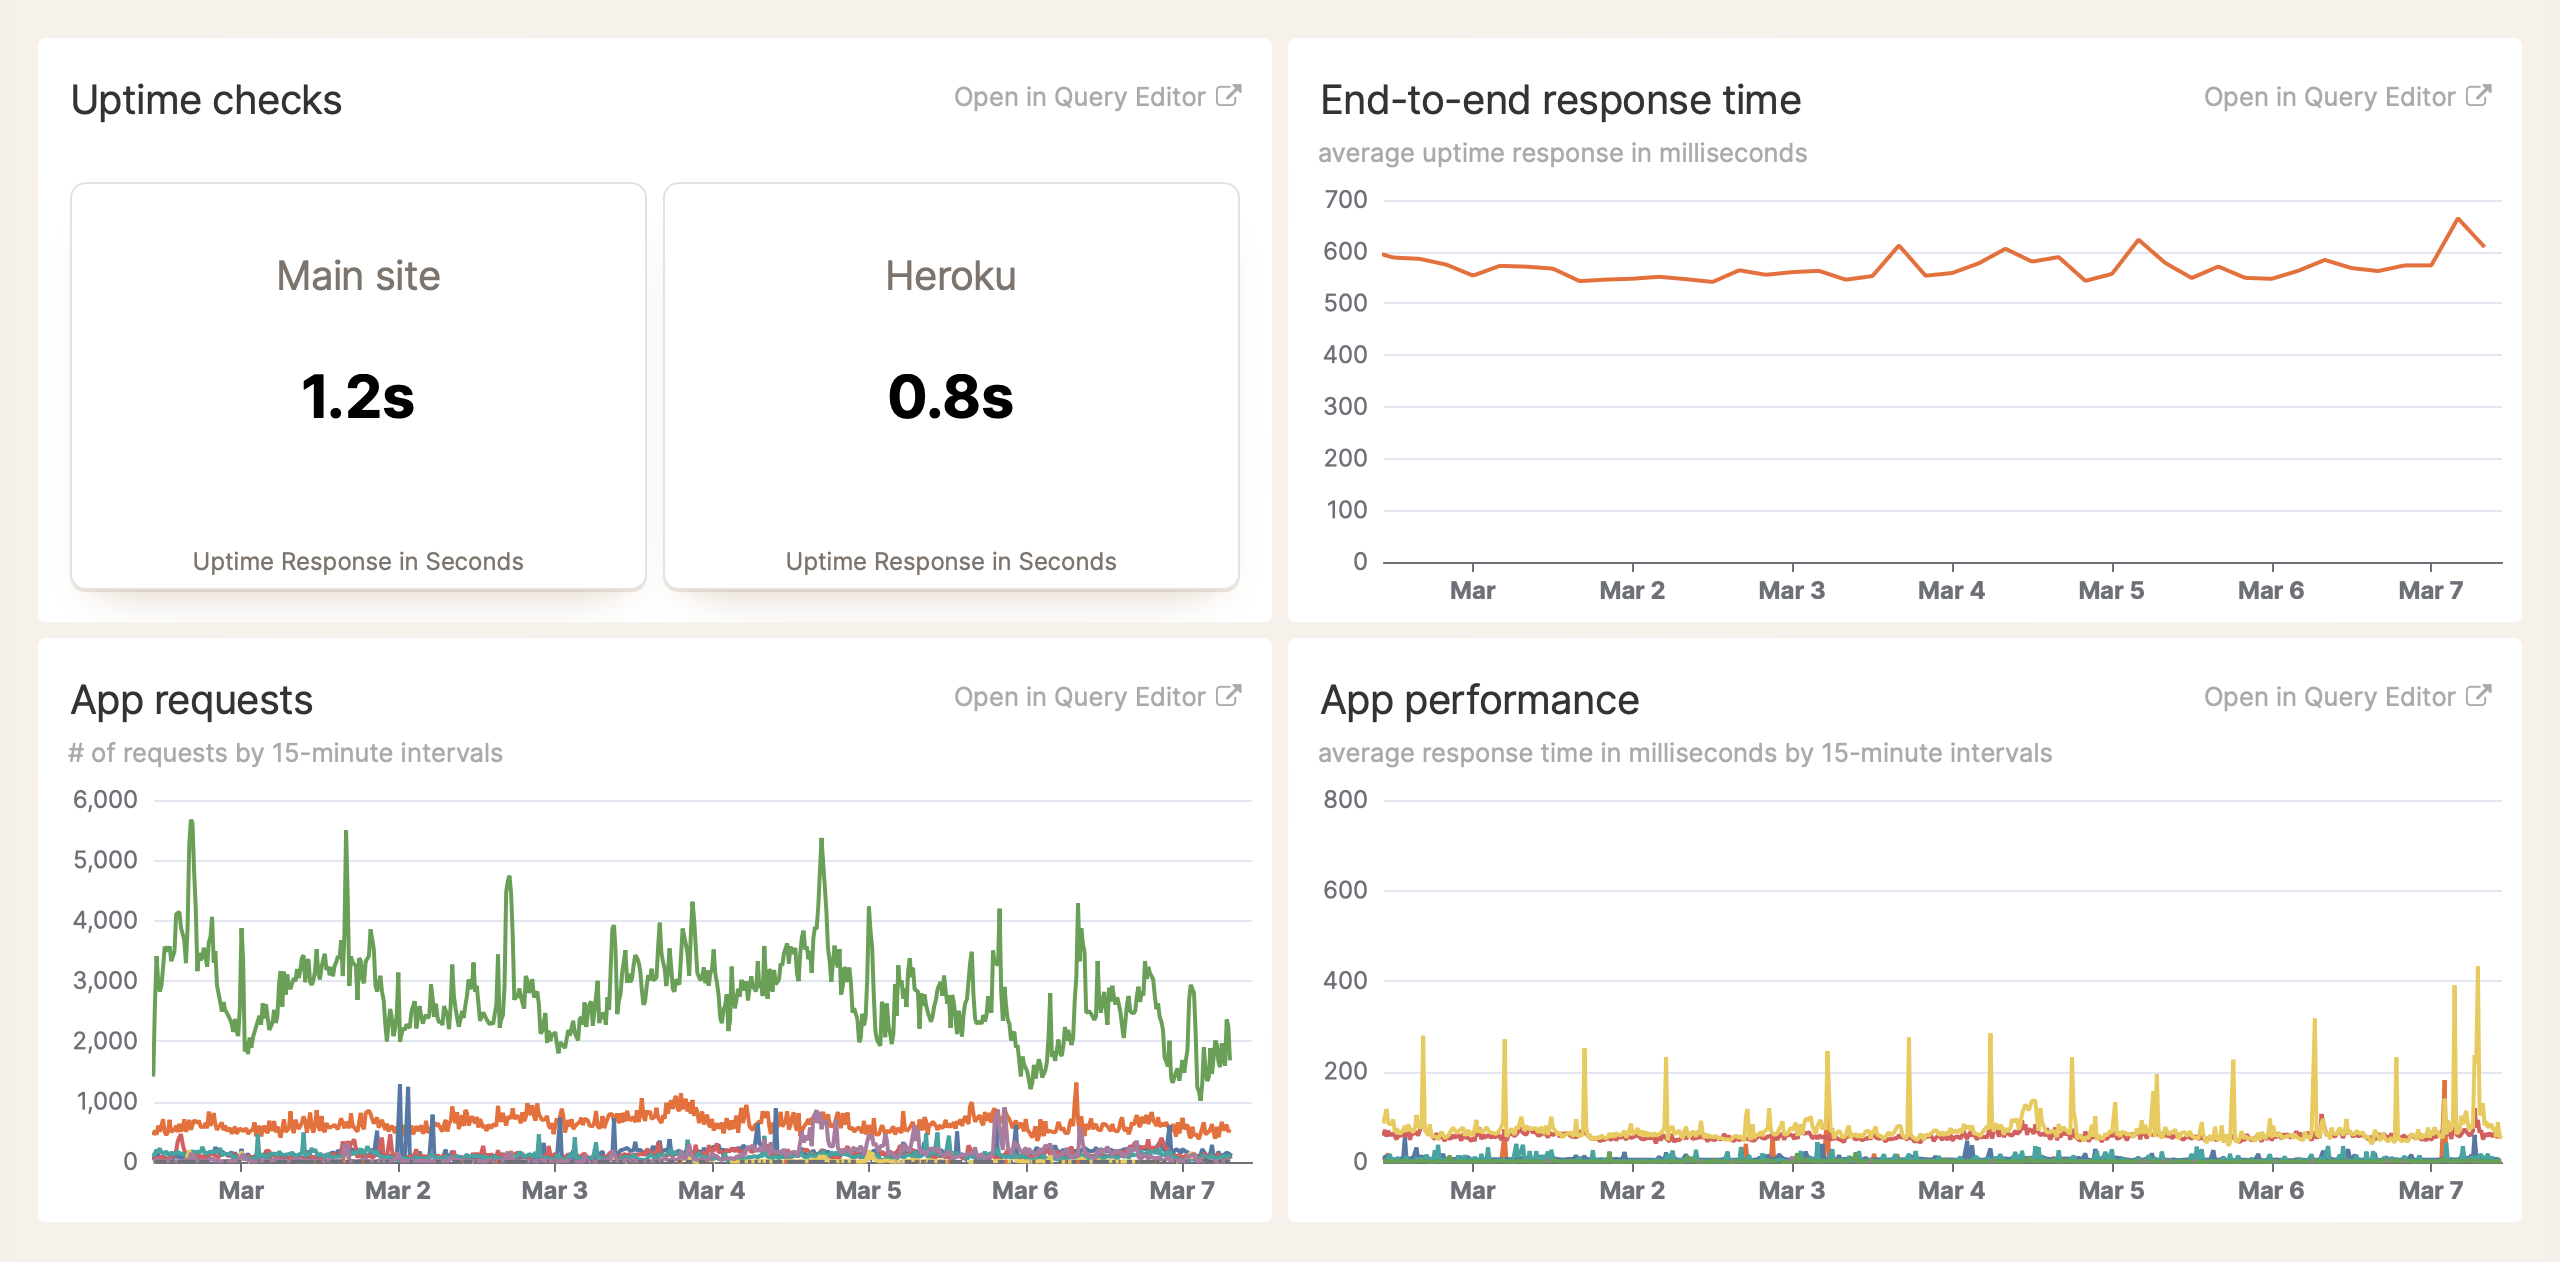
And add the chart to a dashboard:
 It looks like we have some performance optimization work to do!
Our documentation explains how BadgerQL works. Once you start playing with it, we bet you'll have as much fun as we do devising new queries and creating charts with your query results.
If we stopped there, Insights would be a cool feature. But we didn't stop there. 😁
Capture your own structured events
All kinds of events are happening in your application right now. New users are signing up, posting comments, making payments, and so on. With Honeybadger Insights, it's easy to keep a tab on all those activities, find patterns, and dive into the details of who did what and when. And it's not just about metrics—when you can capture extra data about an event, you can do much more than count how often that event happened. For example, let's say you wanted to track which posts have received the most comments in the past day. You could track that event in your Rails app like this:
class Comment < ApplicationRecord
  belongs_to :post
  belongs_to :author

  after_create :track_event

  # ...

  protected

  def track_event
    Honeybadger.event("Comment created", {
      comment: body,
      post: post.attributes.slice(*%w(id title created_at)),
      author: author.attributes.slice(*%w(id name email created_at))
    })
  end
end
Once you start logging that event, and because you are including some additional context about the event, you can answer questions like these:
- How many comments were created in the past day, grouped by hour?
- How long after a post was published was the first comment created?
- What does the comment distribution for a post look like for the week after the post was published?
- Which users created the most comments?
- Which posts had the most engagement?
- What comments did that user create?
- And more!
Once you have the data flowing into Insights, you'll start thinking of more interesting ways to slice and dice your data, and you'll find that it's helpful to have extra contextual data around your events.
Unleash BadgerQL on your application logs
Of course, your logs contain a bunch of interesting data, too. You'll want to query the number of requests your app is serving, how long those requests are taking, and other bits of data you're already logging—and often not analyzing.
Many platforms already log structured events using JSON and logfmt, and if you're not already logging structured events in your applications, it's easy to get started.
We've made it easy to ingest your log data in Insights, whether it is currently in log files, on cloud platforms like Heroku or AWS, or wherever you can slurp it up and POST it as JSON to our API.
What does it cost?
Insights is too good to lock up exclusively in a paid add-on, so we're giving the basics to all Honeybadger users for free! Use it to explore and visualize your Honeybadger data: errors, uptime checks, check-ins, and even notifications.
Insights becomes even more magical when you send more data—structured application logs, metric events, user behavior, analytics, etc. We include a base rate of 50MB/day ingest (about 1.5GB/month!) and 7-day retention for free. If you need more, you can upgrade to one of our paid add-on plans without changing your current Honeybadger plan for errors and uptime monitoring.
Try it now!
Insights is ready and waiting for you to dive in. We already have your Honeybadger data waiting for you, and we have a free tier that you can use to start sending in your own data, too. We hope you'll enjoy using it as much as we do, and this is only the beginning—stay tuned!

Written by
Benjamin CurtisBen has been developing web apps and building startups since '99, and fell in love with Ruby and Rails in 2005. Before co-founding Honeybadger, he launched a couple of his own startups: Catch the Best, to help companies manage the hiring process, and RailsKits, to help Rails developers get a jump start on their projects. Ben's role at Honeybadger ranges from bare-metal to front-end... he keeps the server lights blinking happily, builds a lot of the back-end Rails code, and dips his toes into the front-end code from time to time. When he's not working, Ben likes to hang out with his wife and kids, ride his road bike, and of course hack on open source projects. :)