Observable systems with wide events
Oh, I didn't see you there. Hi, I'm Kevin, a developer here at Honeybadger. I've worked for the last year or so developing Honeybadger Insights, our new logging and observability platform. Let's peek into some of the design decisions and philosophy behind the product.
In modern software development, the hunt for observable systems has traditionally revolved around the holy trinity of logs, metrics, and traces. Each plays a critical role in understanding system behavior, yet they often exist in isolation, each providing a view through a different lens, not to mention a different UI.
At Honeybadger, we're challenging this segmented approach within Insights by focusing on a strategy centered around events.
Your logs are events—and they should be structured
I get it—you're probably thinking, "Can't I just stick to grepping through my stringy logs?" Shifting to thinking in terms of structured events can require practical (and philosophical) changes in how we gather telemetry data from our applications. We believe this transition can lead to more opportunities for analyzing and extracting valuable information about our systems' behavior.
Take this string log, for example:
[INFO 2023-03-10 14:00:00][location: Seattle, USA] -- : UserLoginAttempt: User JohnDoe (standard_user) Login successful after 2 attempts from 192.168.1.1
Egads, the implicit structure! While this format can be easy on the eyes when tailing from your local server, it's also a nightmare if you want to extract useful data points. Here is what that same log could look like as a structured event in JSON format:
{
  "event_type": "UserLoginAttempt",
  "ts": "2023-03-10T14:00:00Z",
  "user": {
    "name": "JohnDoe",
    "role": "standard_user"
  },
  "source_ip": "192.168.1.1",
  "location": {
    "city": "Seattle",
    "country": "USA"
  },
  "successful": true,
  "attempts": 2
}
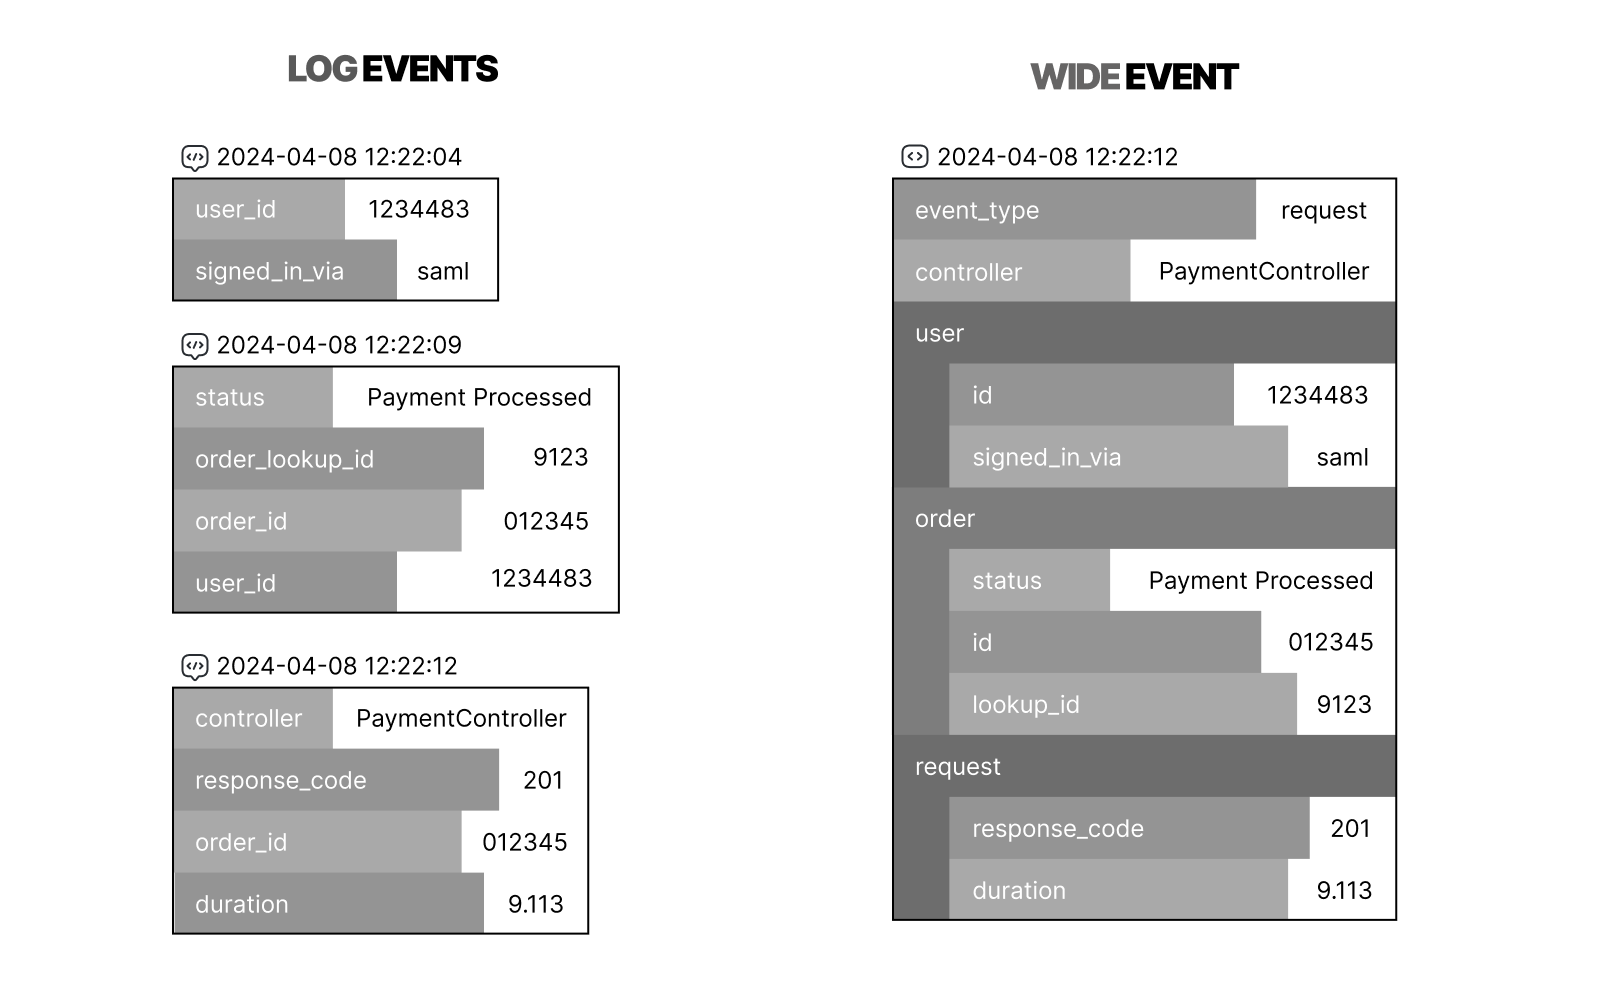
Think of a structured event as a bag of correlated properties called "fields." These two events are technically the same—but can you see how breaking up the fields creates possibilities for extracting insights?
Moving to structured events enables you to query them with
BadgerQL, the powerful
query language at the heart of Honeybadger Insights. It's far beyond anything
you could do with grep or other text-based search tools.
Say you want to find users with the most login attempts:
fields user.name::str
| sort attempts::int desc
Or login attempt counts per city:
stats count() as ct by location.city::str
What about finding which users often require multiple attempts:
filter successful::bool
| stats avg(attempts::int) as avgAttempts by user.name::str
| filter avgAttempts > 2
Or which users connect from multiple IP addresses:
stats unique(source_ip::str) as ipCount by user.name::str
| filter ipCount >= 2
There is critical data juice located even within the simplest of events, and we aim to give you tools to squeeze it all out.
The power of wide events
You may have heard us mention "wide" events. Wide events are helpful because they often contain comprehensive contextual data about an execution. Instead of blasting thousands of small logs per request, a wide event gathers important contextual data into a single event.
These events support "observability" by providing the details necessary during those critical moments of "unknown unknowns"—where elusive bugs lurk in the shadows, ready to disrupt your system with the slightest trigger. Sometimes, a detail that seems insignificant can be crucial to finding the cause of an issue. Wide events serve as your diagnostic beacon, offering clues and context that traditional observability methods might miss.
One tenet of observability is relying on externals (the events) to paint a picture of your system's state without needing to update your code to produce more data. Since we store events in their raw form without pre-aggregating or performing other lossy shenanigans, you can ask any question about your system in real time.
Errors are wide events
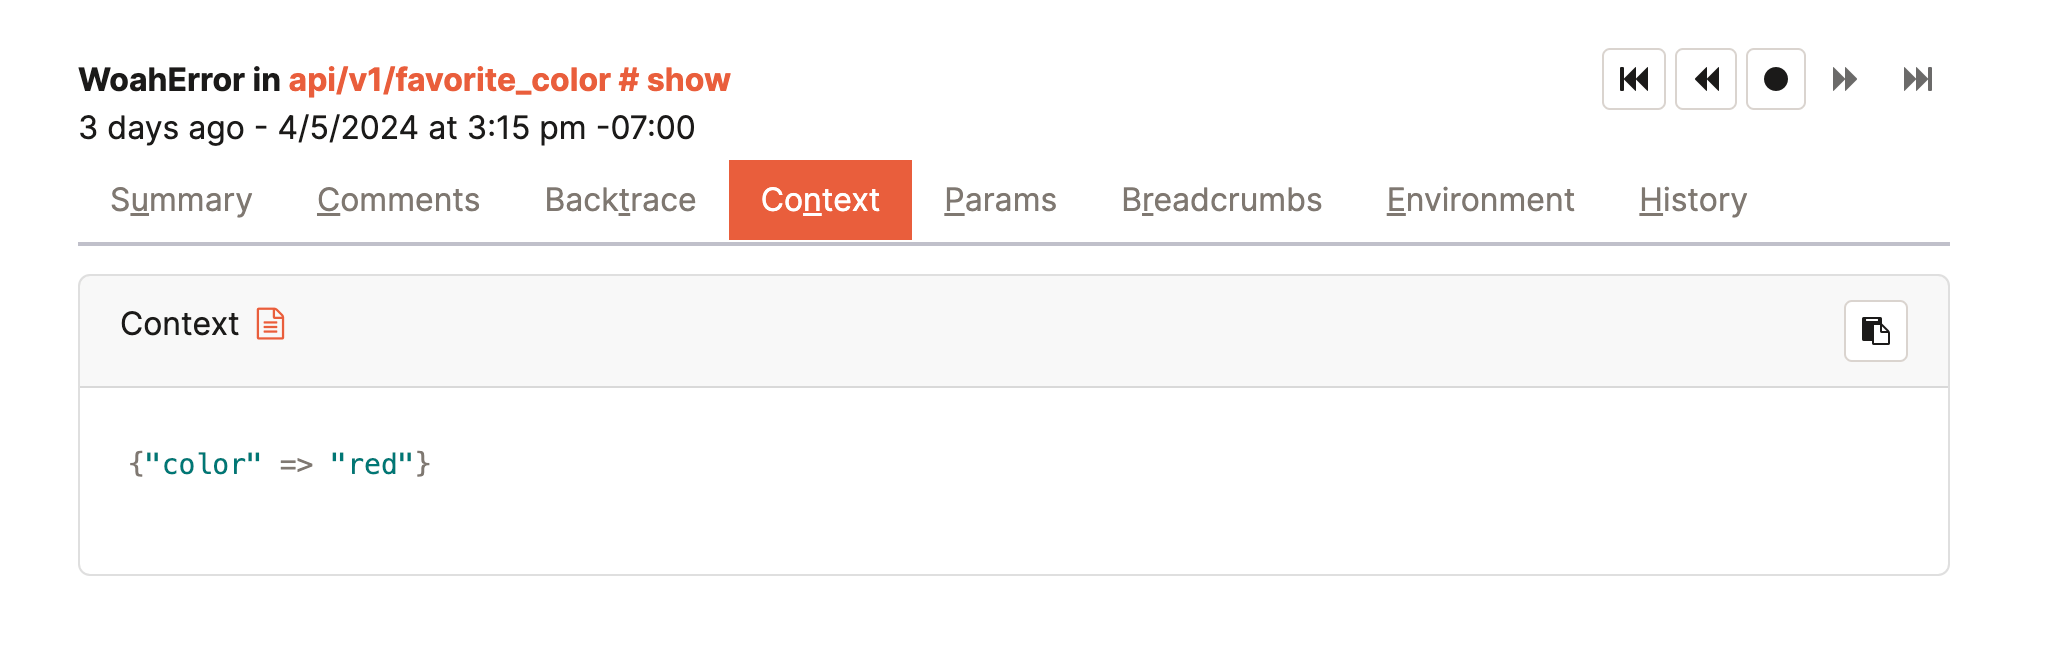
If you are a Honeybadger user, you already have a great example of a wide event: the error notice. You might be familiar with adding context to an error:
Honeybadger.context(color: "red")
This context is built up during execution, and if something goes wrong, the client sends the error to Honeybadger with all context data attached. While debugging, this context can be essential to finding the cause of the error.
We treat errors as first-class entities so you can coordinate and communicate while resolving issues, but error notices are also events. In fact, all error notices you send to Honeybadger are automatically added to Insights. You can use BadgerQL to query, slice, and visualize just as you would with any structured event. To get a list of all notices, all that's required is to filter on the event type:
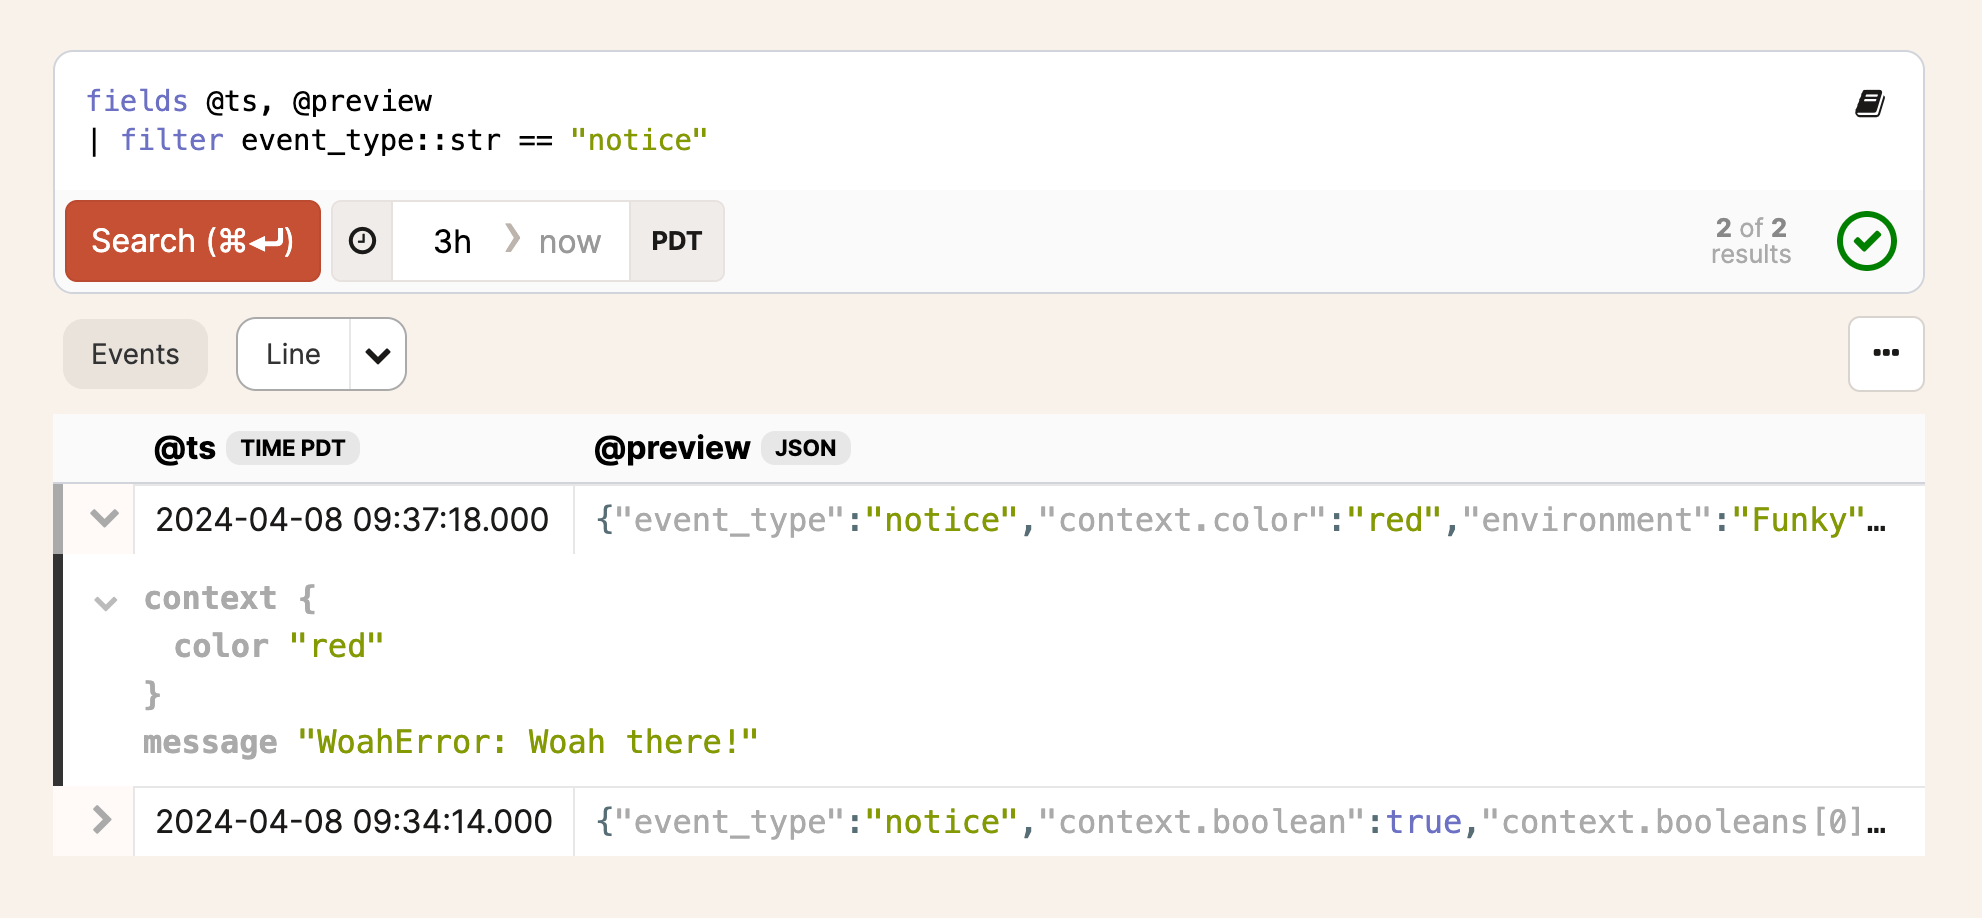
And you can start gathering insights about your errors.
What about metrics and traces?
Metrics and traces are structured events, too, and we believe they should live alongside your "log" events, where you can use the same tools for querying and visualization. That's one reason we started with application logs—you get the other two for free.
Honeybadger automatically instruments your application, collecting telemetry and performance metrics from popular frameworks and libraries with support for Ruby, PHP, Elixir, and Python (beta). Metrics arrive as structured events in Honeybadger, where you can query them alongside your logs and application events:
filter event_type::str == "process_action.action_controller"
| stats avg(duration::float)
When you select your framework from our list of automatic monitoring dashboards, you can visualize your application's performance in real-time:
 Automatic Rails performance dashboard powered by structured events
You can also send your own custom metrics to track what matters most to your application. For example, in Ruby, you might track the size of a data processing queue:
Honeybadger.gauge('queue.size', -> { ProcessingQueue.pending.count })
Or count specific business events:
Honeybadger.increment_counter("payment.processed", { amount: payment.amount })
These custom metrics are all just structured events under the hood, which means you can query them, create custom charts and dashboards, and correlate them with your logs and errors.
Related events are correlated by request ID in Honeybadger, giving you one unified system for metrics, logs, and traces. As we continue to instrument more languages and frameworks, the foundation remains the same: wide events that capture the full context of what's happening in your system.
Events create observability
Transforming your logs into structured events is a crucial first step toward gaining observability into your system. When you do, Honeybadger is here to help you dig in, cut through the noise, and squeeze out the insights. Give it a try!

Written by
Kevin WebsterKevin is the freshest Honeybadger (both in time and breakdancing abilities). Kevin has been building things with software since his dad brought home the family IBM 386. He fancies himself a bit of a programming polyglot. When he's not compromising his ability to write Ruby by learning new languages, he enjoys hiking through the Oregon wilderness, hanging with his family, or watching cringeworthy b-list movies.