Visualizing Ahoy analytics in Rails

Honeybadger co-founder Joshua Wood explains how to graph Ahoy page views in Rails with Chartkick, with a preview of our upcoming observability tool—Insights!

At Honeybadger, we use Ahoy for first-party analytics in Rails. Ahoy is excellent for developers because it lives in your Rails application alongside your other data and code. Want to answer a specific question about your product or website visitors? It's just one ActiveRecord query away:

Ahoy::Event.where_event("$view", page: "/").count

Ahoy also works with Chartkick and Groupdate to visualize your data. For example, after installing the two libraries, you can add a chart of all page views to any Rails view:

<%=
  line_chart Ahoy::Event.
    where_event("$view", page: "/").
    group_by_hour(:time).
    count
%>

The above code produces a chart like this:

A line graph with a time series on the x-axis ranging from "Feb 7, 2 PM" to "Feb 9, 8 AM". The y-axis starts at 0 and extends upward, though the upper limit isn't visible; it's at least 600 based on the graph's peak. The line plot has significant fluctuations: starting at a value around 100, it spikes to just above 600, drops back near 100, rises again slightly above 200, then drops to nearly 0 where it remains flat until a small uptick near "Feb 9, 8 AM". This could represent a metric like website visitors or system performance over time, indicating a peak in activity or usage early on, followed by a period of inactivity or normal levels. The context of the data is not provided in the image. 
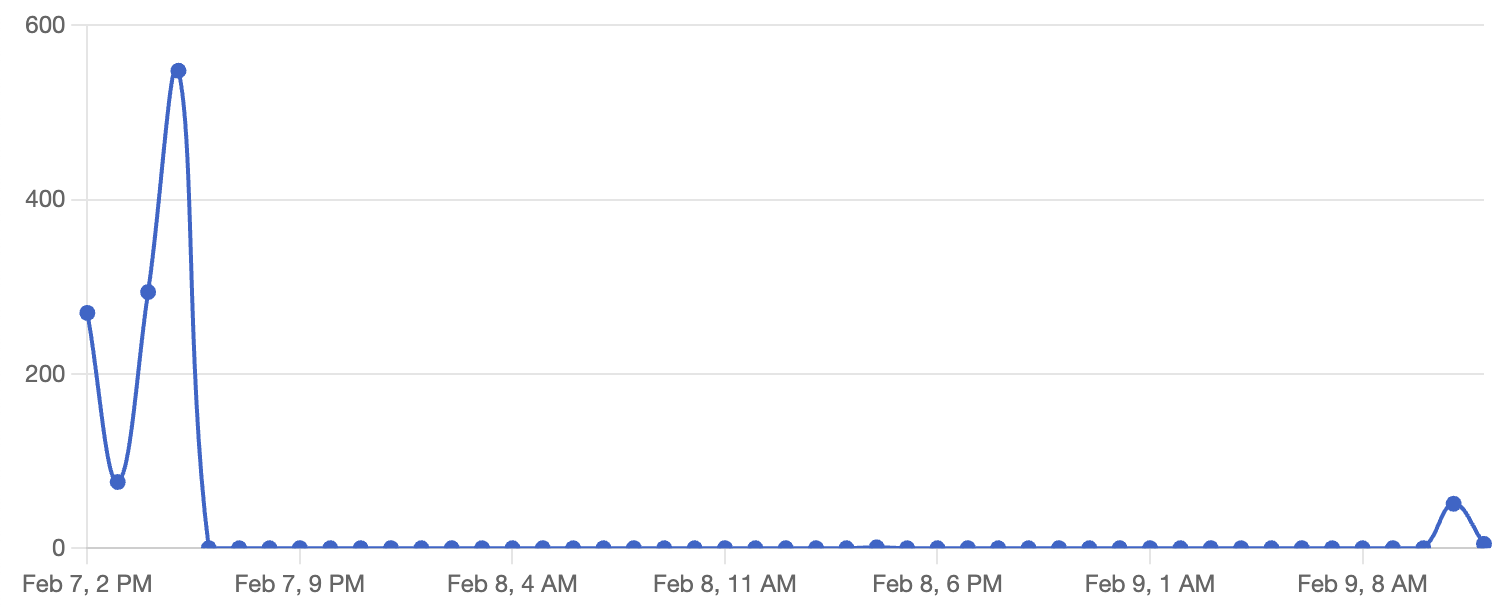
Charting Ahoy data with Chartkick

Ahoy and Chartkick are great for tracking analytics and building dashboards, but the downside is that you must deploy your app to make changes. If you find yourself regularly deploying to update your dashboards, you could try using Blazer, which lets you explore your data and create charts and dashboards with SQL.

A screenshot of a web-based database interface showing a SQL query result. The SQL command "SELECT * FROM "ratings" LIMIT 10" is visible, suggesting the user has queried the first 10 rows from a 'ratings' table. Displayed are columns for 'id', 'user_id', 'movie_id', 'rating', and 'rated_at'. Five rows are visible. 
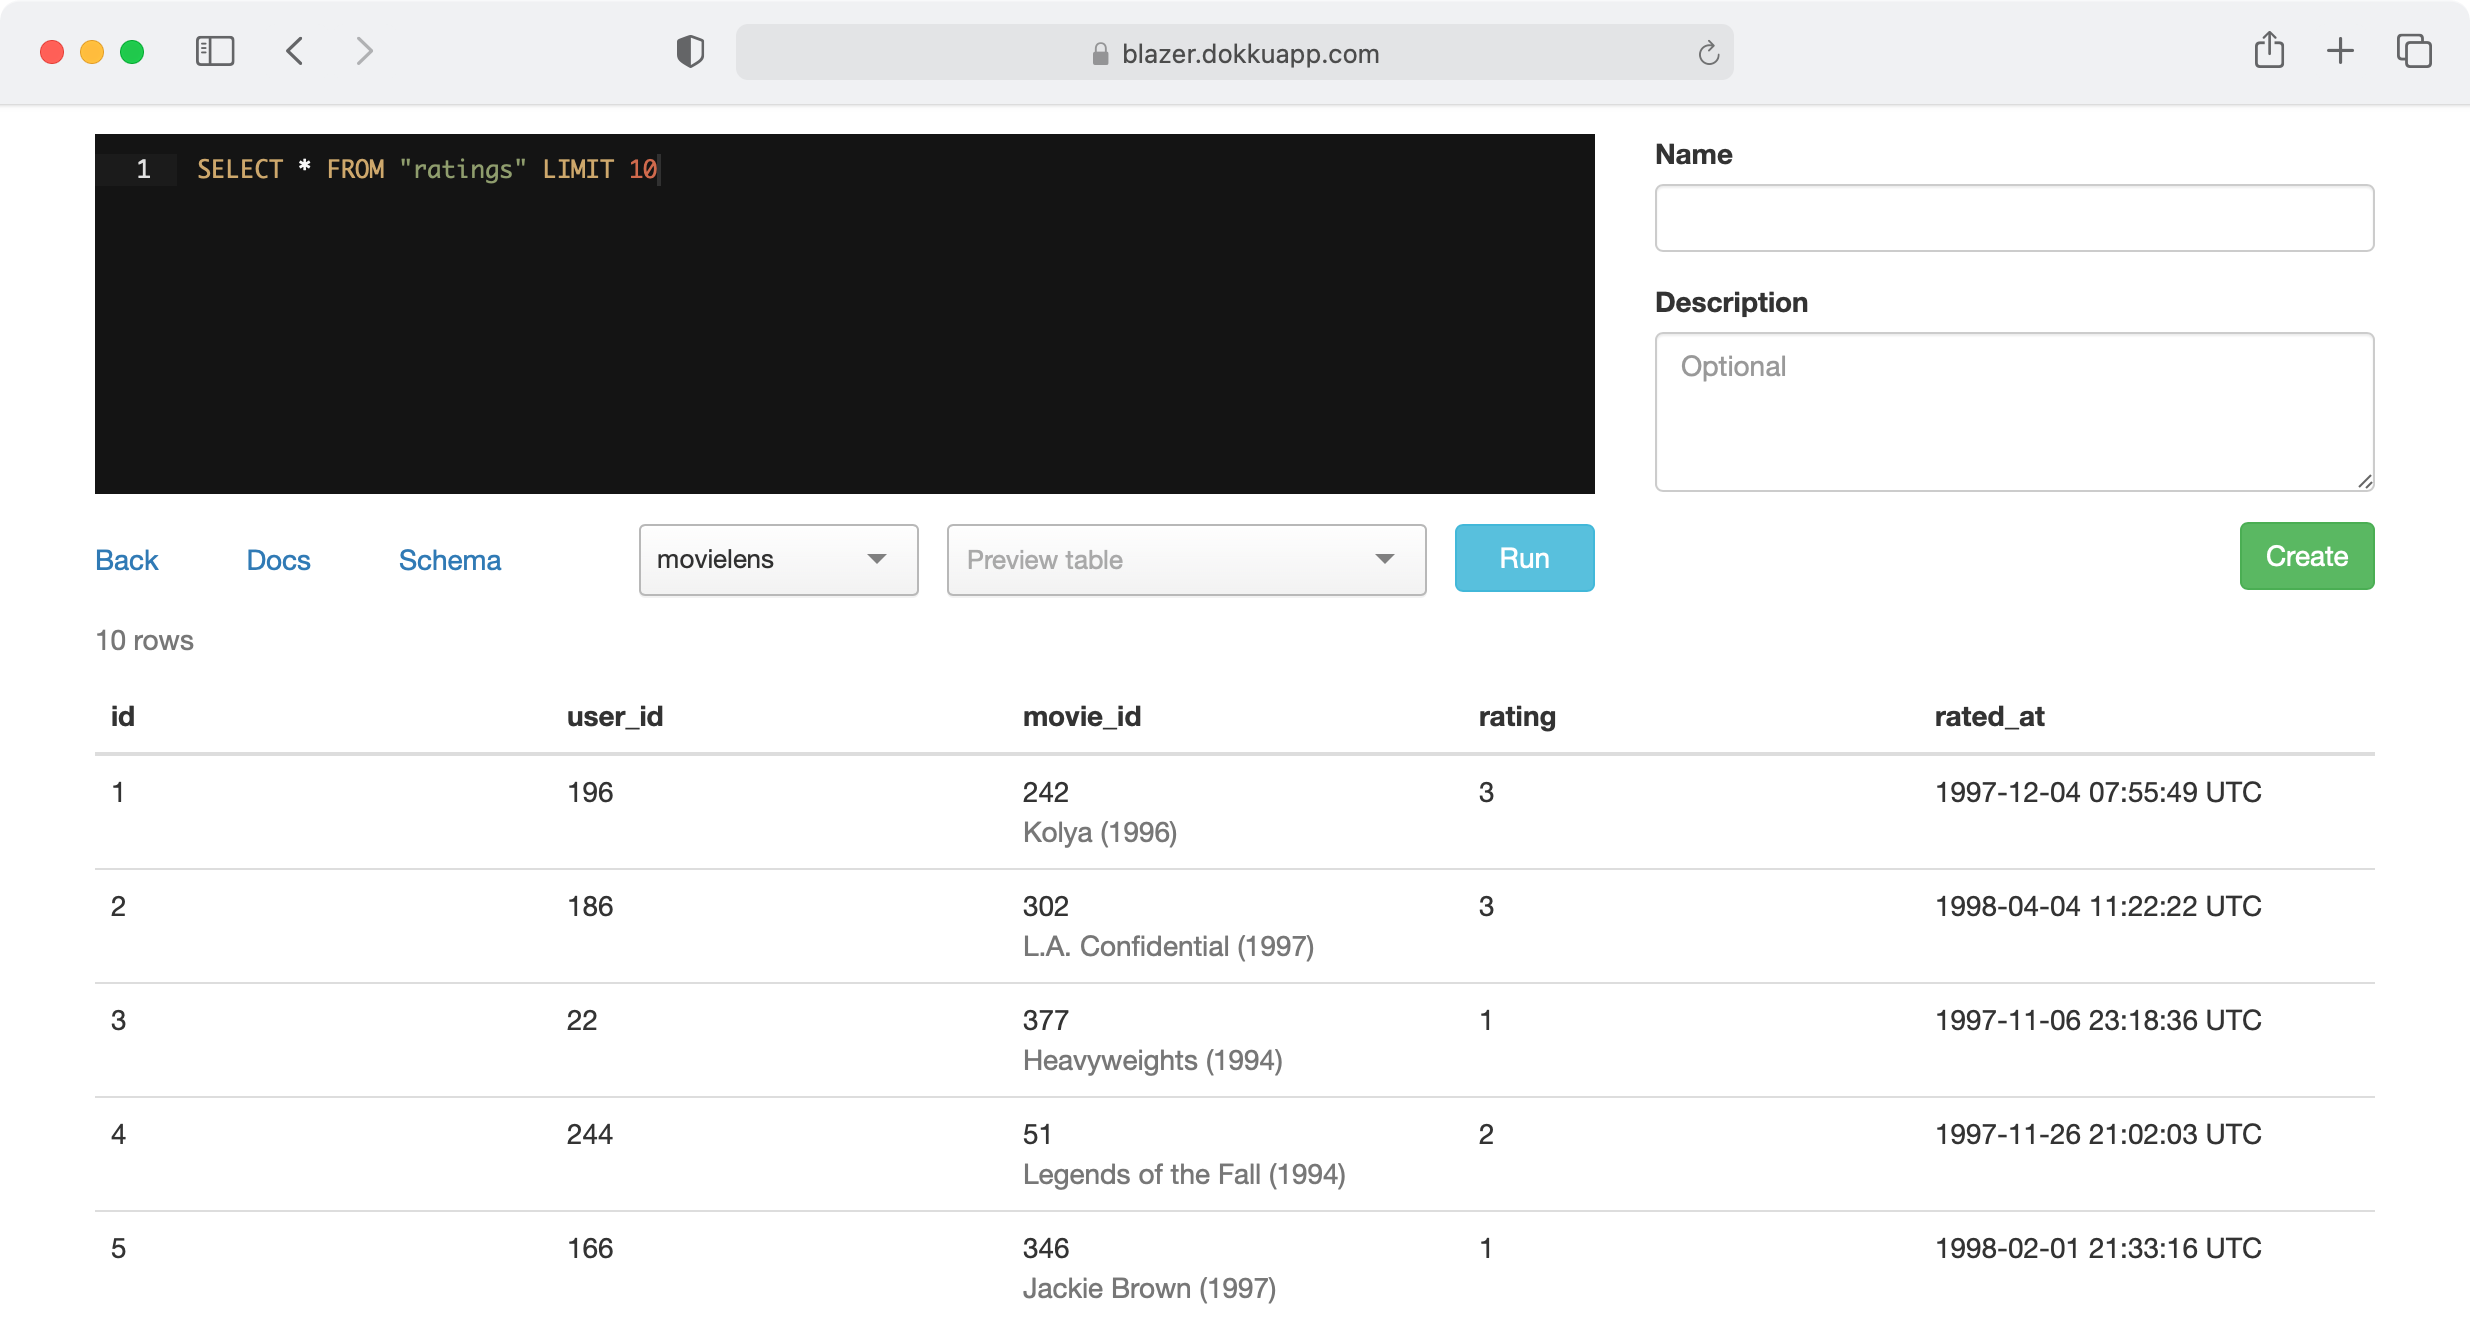
Screenshot from Blazer README

That said, SQL can be complex to work with. At Honeybadger, we've used the Ahoy+Chartkick+Blazer stack for years and recently augmented Ahoy's data store to send events to Honeybadger Insights so that we can explore our web analytics and create dashboards alongside our other observability data.

Integrating Ahoy with Honeybadger Insights

Honeybadger Insights is a new logging and observability tool that we recently added to Honeybadger. You can use our query language—BadgerQL—to dive into your Honeybadger data (errors, uptime events, etc.) and create charts and dashboards from BadgerQL queries. You can also ship us your application logs and custom events to have all of your data in one place.

Here's how to integrate Ahoy with Honeybadger Insights and create a similar chart to Chartkick using BadgerQL.

In Rails, if you aren't using the honeybadger gem yet, you'll need to install it. Follow the Rails integration instructions (usually takes just a few minutes).

If you're already use the honeybadger gem, I recommend upgrading to the latest version. First, make sure the honeybadger gem is pinned to version ~> 5.5 in your Gemfile:

# Gemfile
gem "honeybadger", "~> 5.5"

Then upgrade to the latest version:

bundle update honeybadger

Next, open config/initializers/ahoy.rb in a text editor, and modify the default Ahoy::Store to look like this:

class Ahoy::Store < Ahoy::DatabaseStore
  def track_visit(data)
    Honeybadger.event("ahoy_visit", data)
    super(data)
  end

  def track_event(data)
    Honeybadger.event("ahoy_event", data)
    super(data)
  end

  def geocode(data)
    Honeybadger.event("ahoy_geocode", data)
    super(data)
  end

  def authenticate(data)
    Honeybadger.event("ahoy_authenticate", data)
    super(data)
  end
end

That's it. To test in your development environment, you can run rails server with the HONEYBADGER_REPORT_DATA=true environment variable to temporarily turn off Honeybadger's development mode.

HONEYBADGER_REPORT_DATA=true rails server

As Ahoy collects events, you should see them on the Insights tab in your Honeybadger project:

A screenshot of an insights dashboard in Honeybadger. It shows a search interface with a query for fields 'ts' and 'preview' sorted by 'ts' (timestamp). The timeframe of "2d -> now" indicates a search for the past two days up to the current time in PST (Pacific Standard Time). Below the search bar, the results display an "Events" view selected from a dropdown that also includes a "Line" view. Each entry corresponds to a timestamped event, labeled with "@ts" for the time in PST and "@preview" which contains JSON formatted data. The JSON data includes an "event_type": "ahoy_event" and an "event_id", with each event having a unique ID. All events are tagged with the name "$view", suggesting they are page or view-related events within the application, possibly tracking user interactions. The events are listed in reverse chronological order, the most recent being at "2024-02-09 12:02:11.000" and the oldest visible at "2024-02-09 11:53:53.000". The green checkmark indicates 100 of 100 results displayed successfully. 
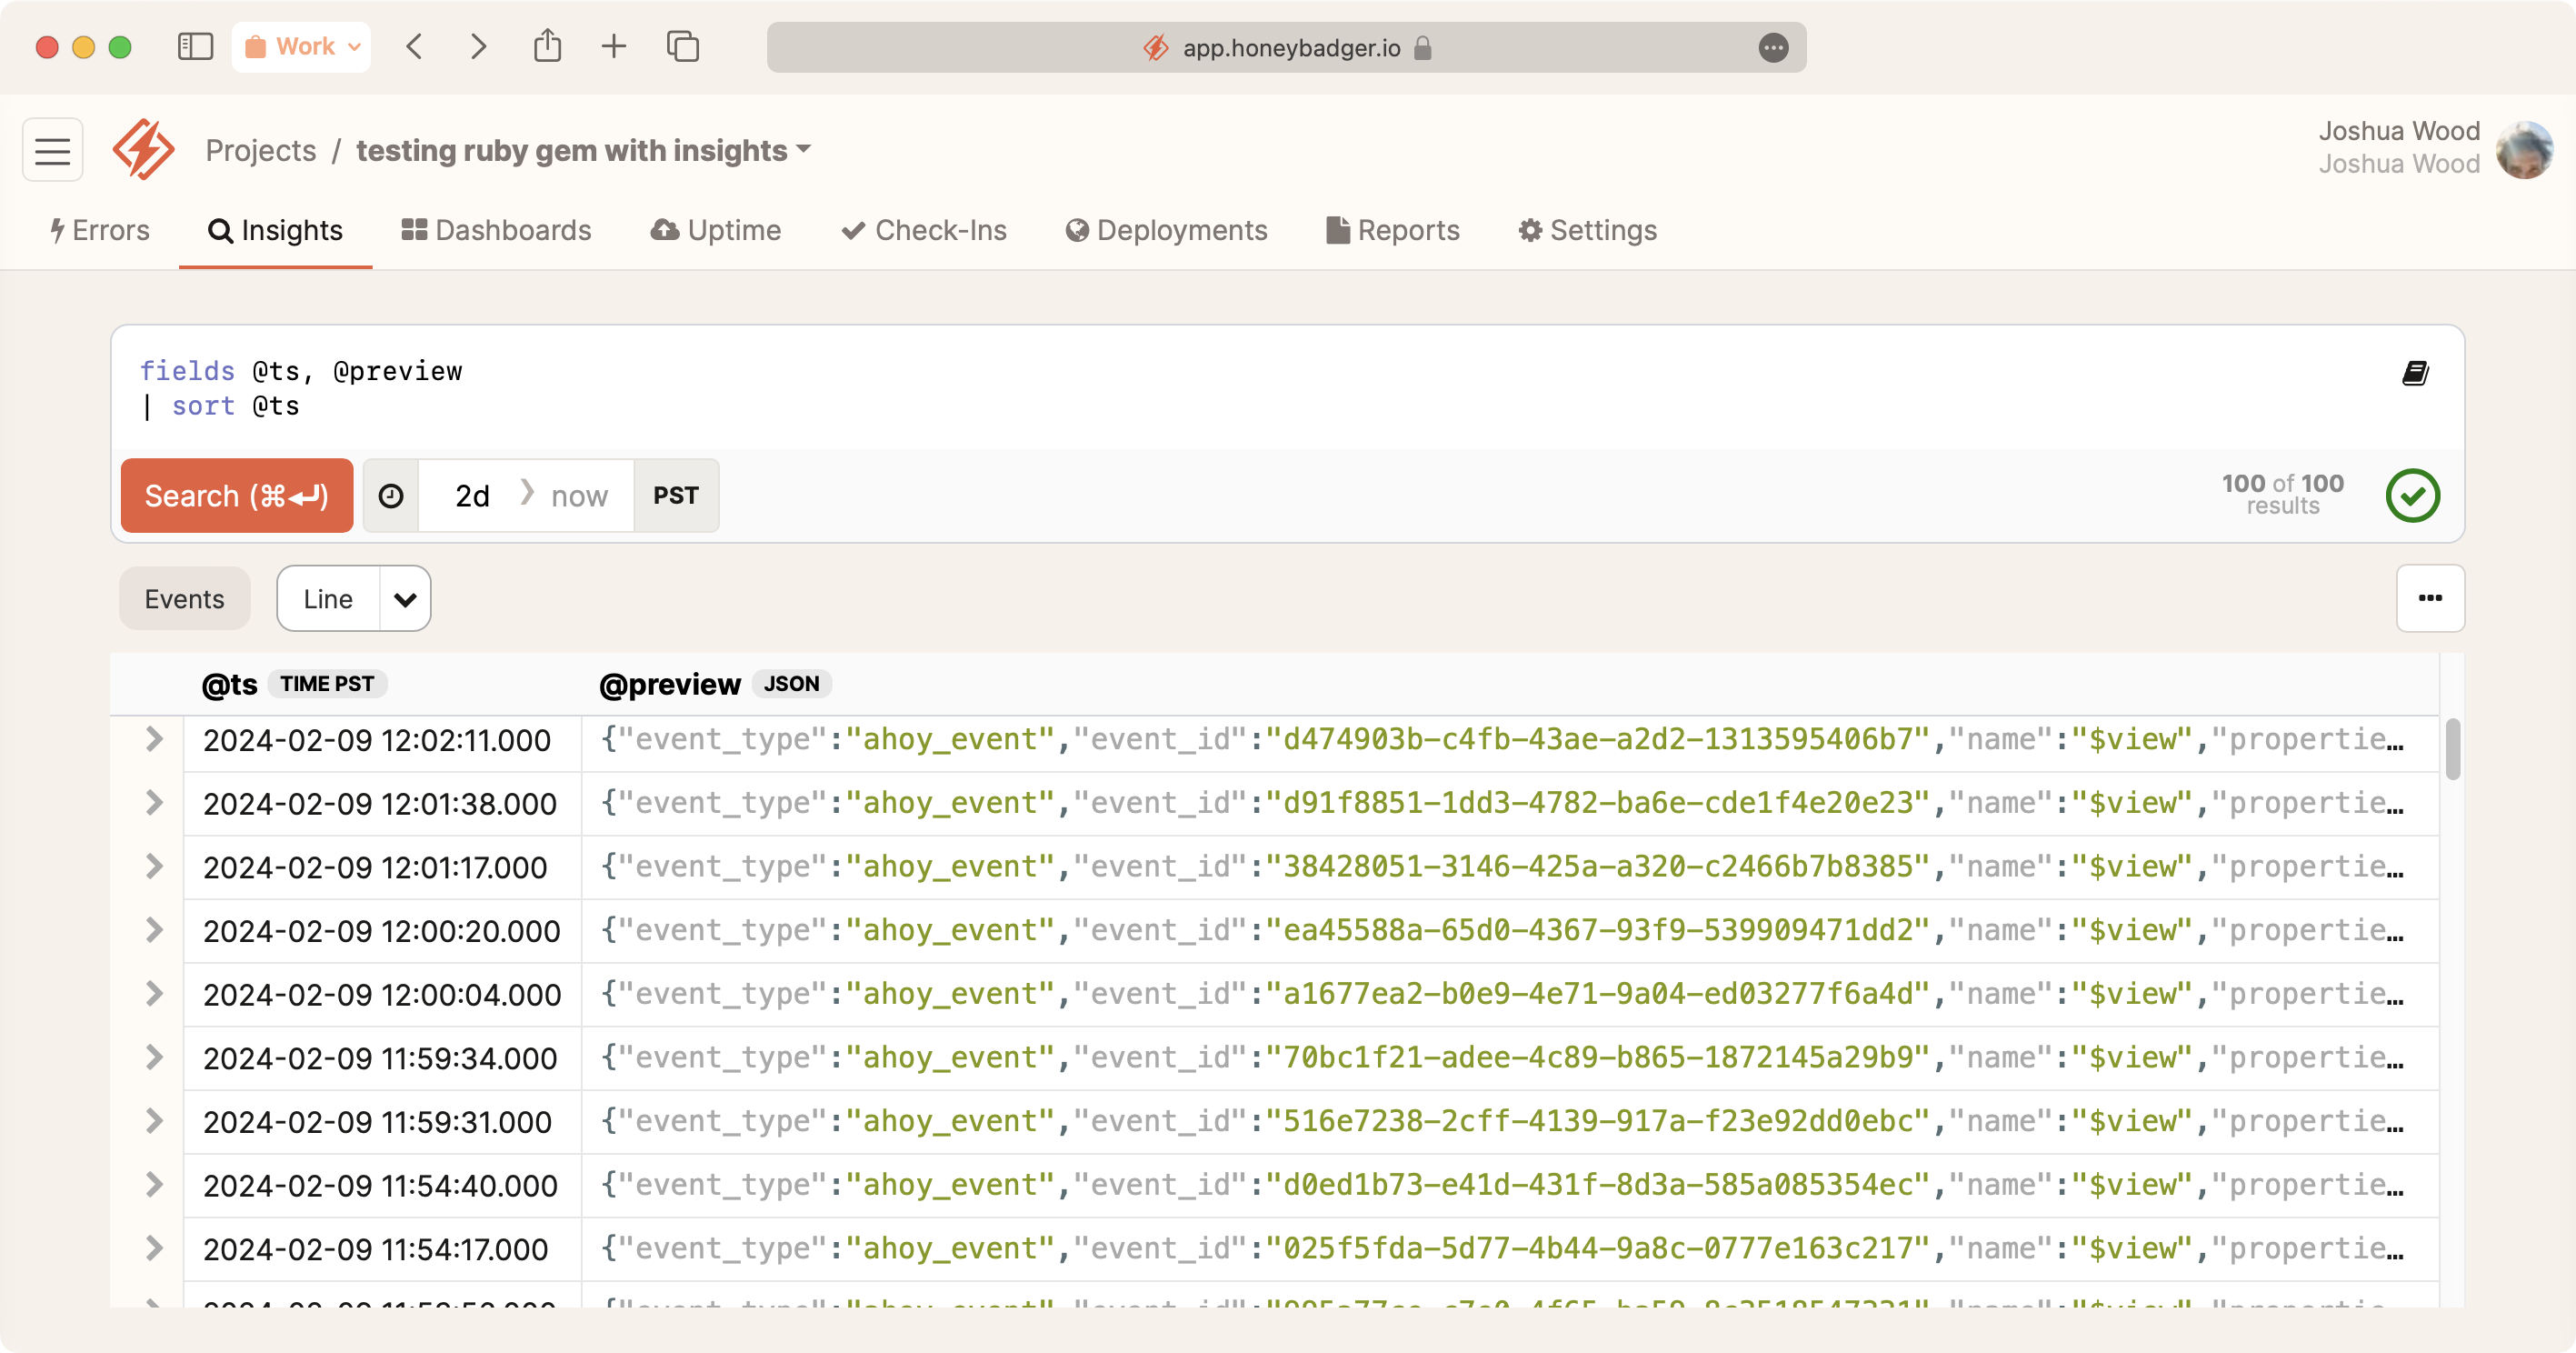
Ahoy events in Honeybadger Insights

To create a chart similar to the Chartkick example above, drop the following BadgerQL into the query box and hit Search.

filter event_type::str == "ahoy_event"
| filter name::str == "$view"
| stats count() by bin(1h) as date
| fill date step 1h
| sort date

A web analytics dashboard with a search query for event tracking, specifically filtering for "ahoy_event" of type "$view". The results are aggregated by the count of events per hour, sorted by date and time in PST. The table shows several rows with 'count()' and corresponding 'date' columns, with counts of 549, 296, 76, and 270 events at different hourly intervals on February 7, 2024, indicating fluctuating user engagement over time. The latest times show zero events, suggesting no activity or data collection during those periods. For a walkthrough of the BadgerQL in this query, check out my screencast on YouTube

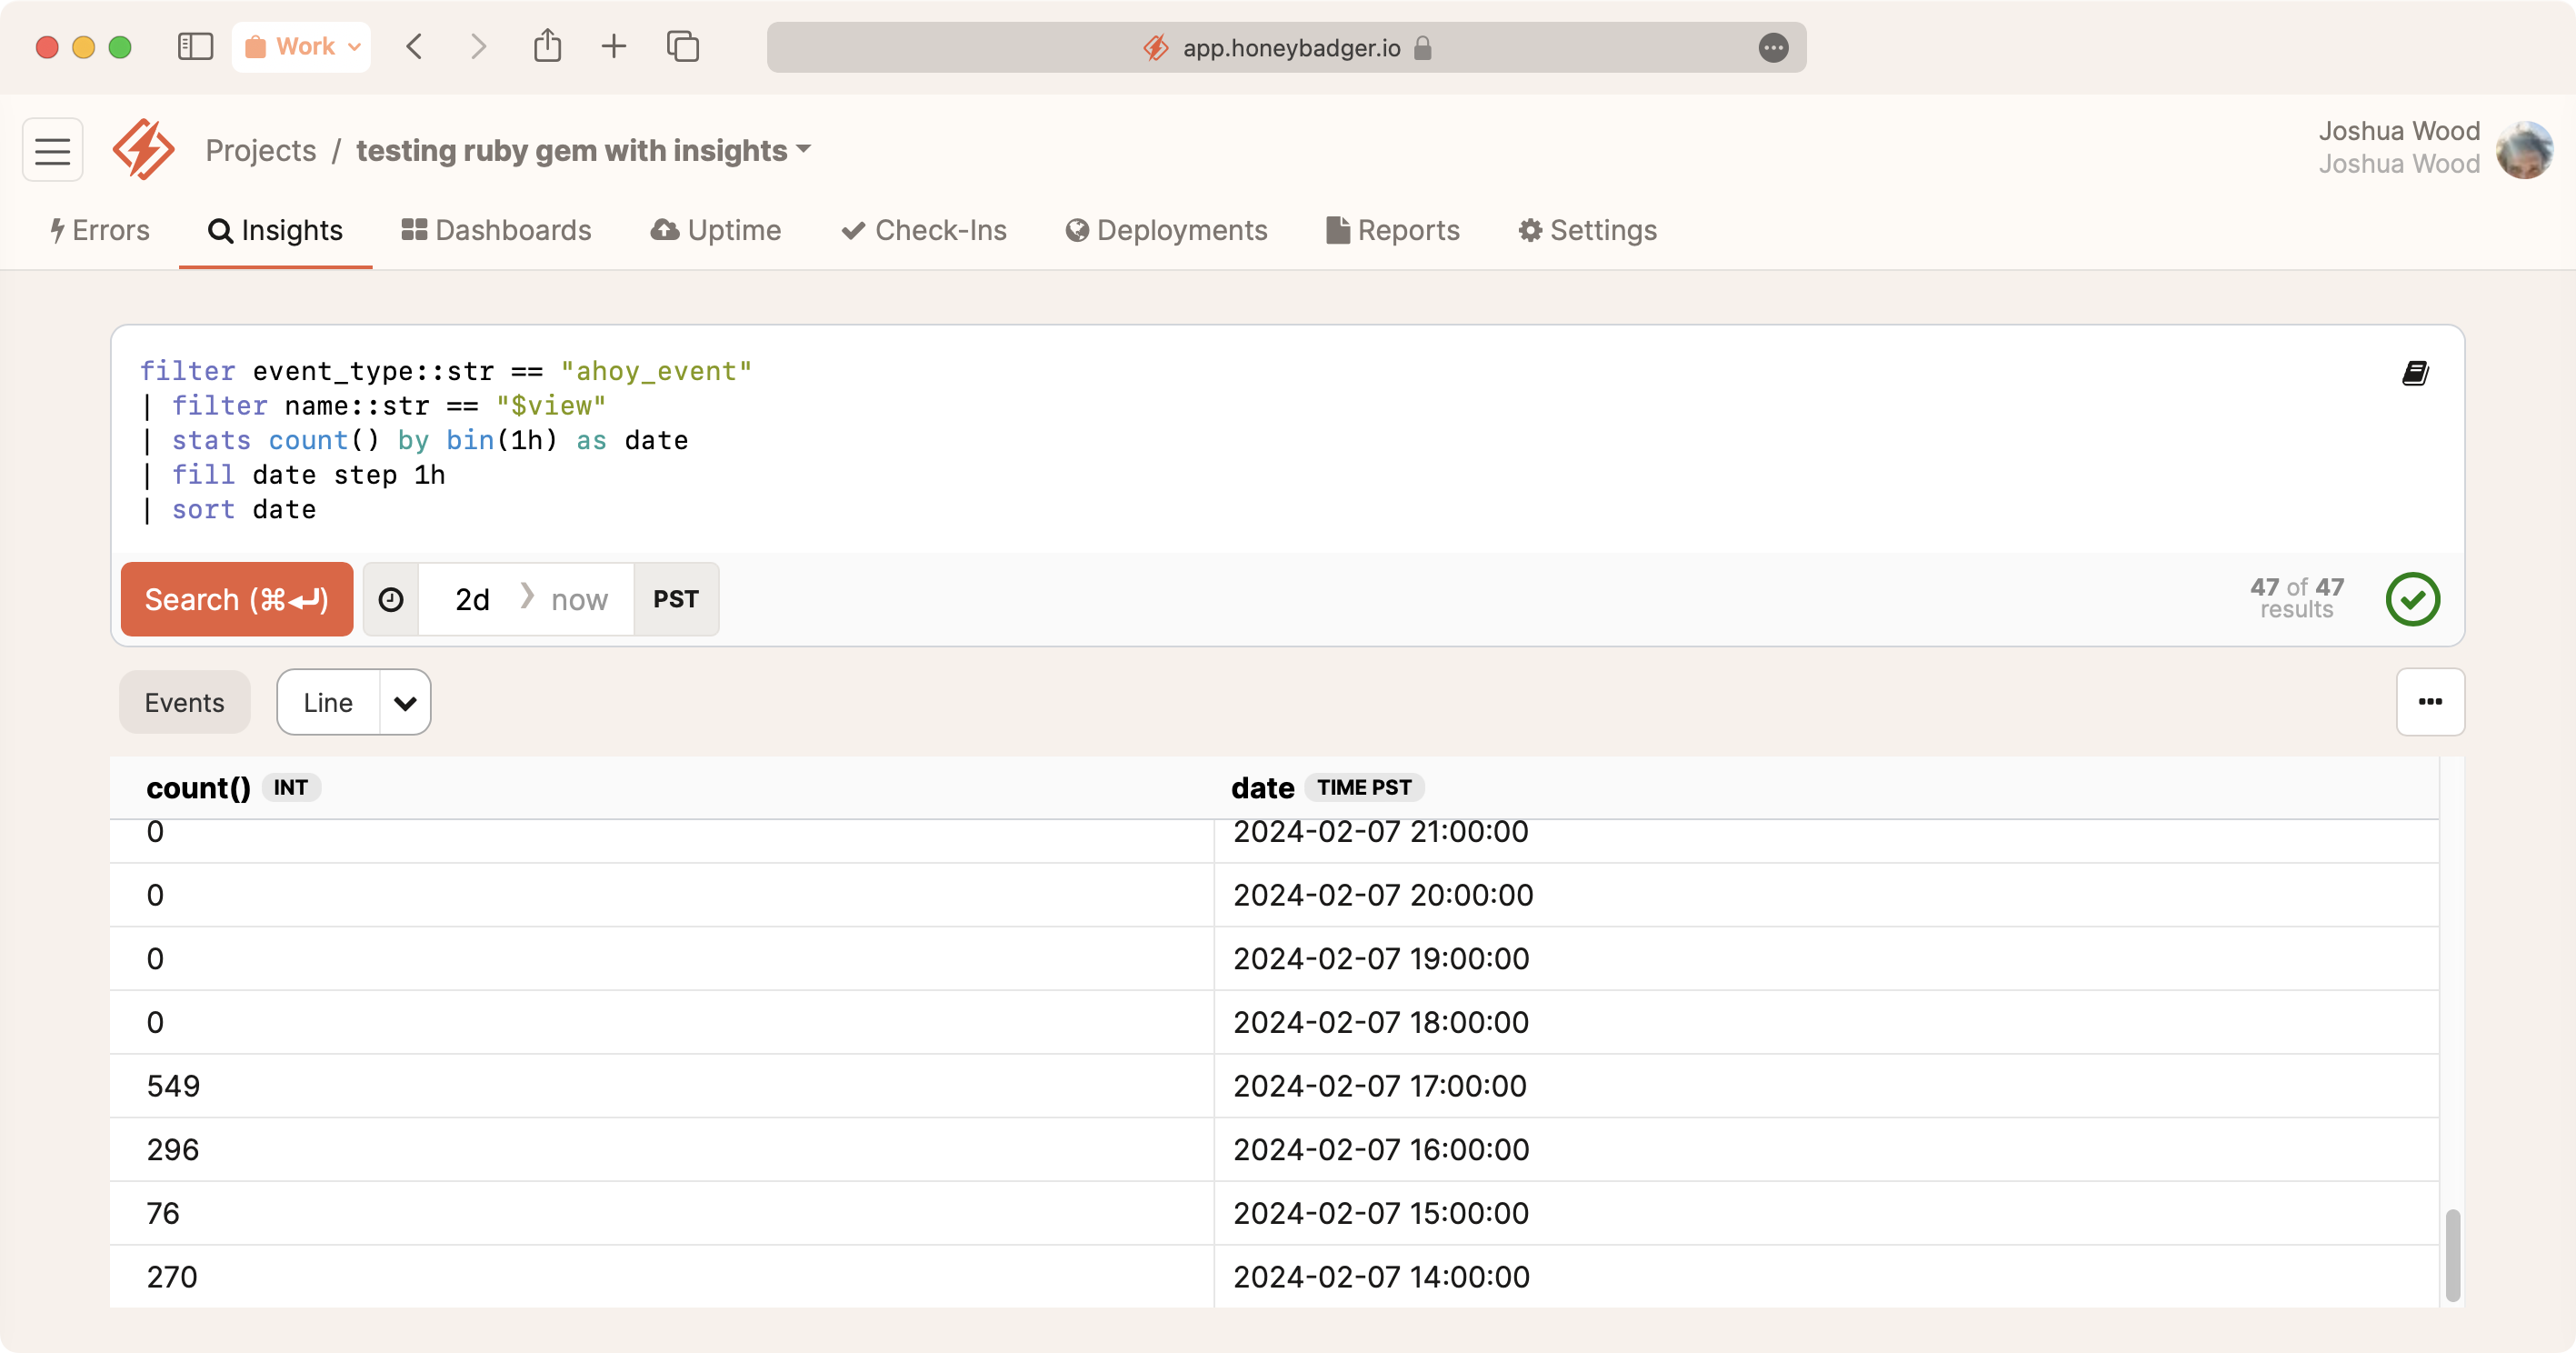
Finally, toggle the Line button to visualize the data as a line chart:

A line chart on a web analytics dashboard displays event counts over time. A prominent spike to nearly 600 events occurs around 17:00 on February 7, with other notable activity around 06:00 on February 9. The x-axis covers a period from 18:00 on one day to 12:00 the next, while the y-axis ranges from 0 to 600. The chart is part of the Honeybadger app interface with query filters visible, set to the PST timezone. 
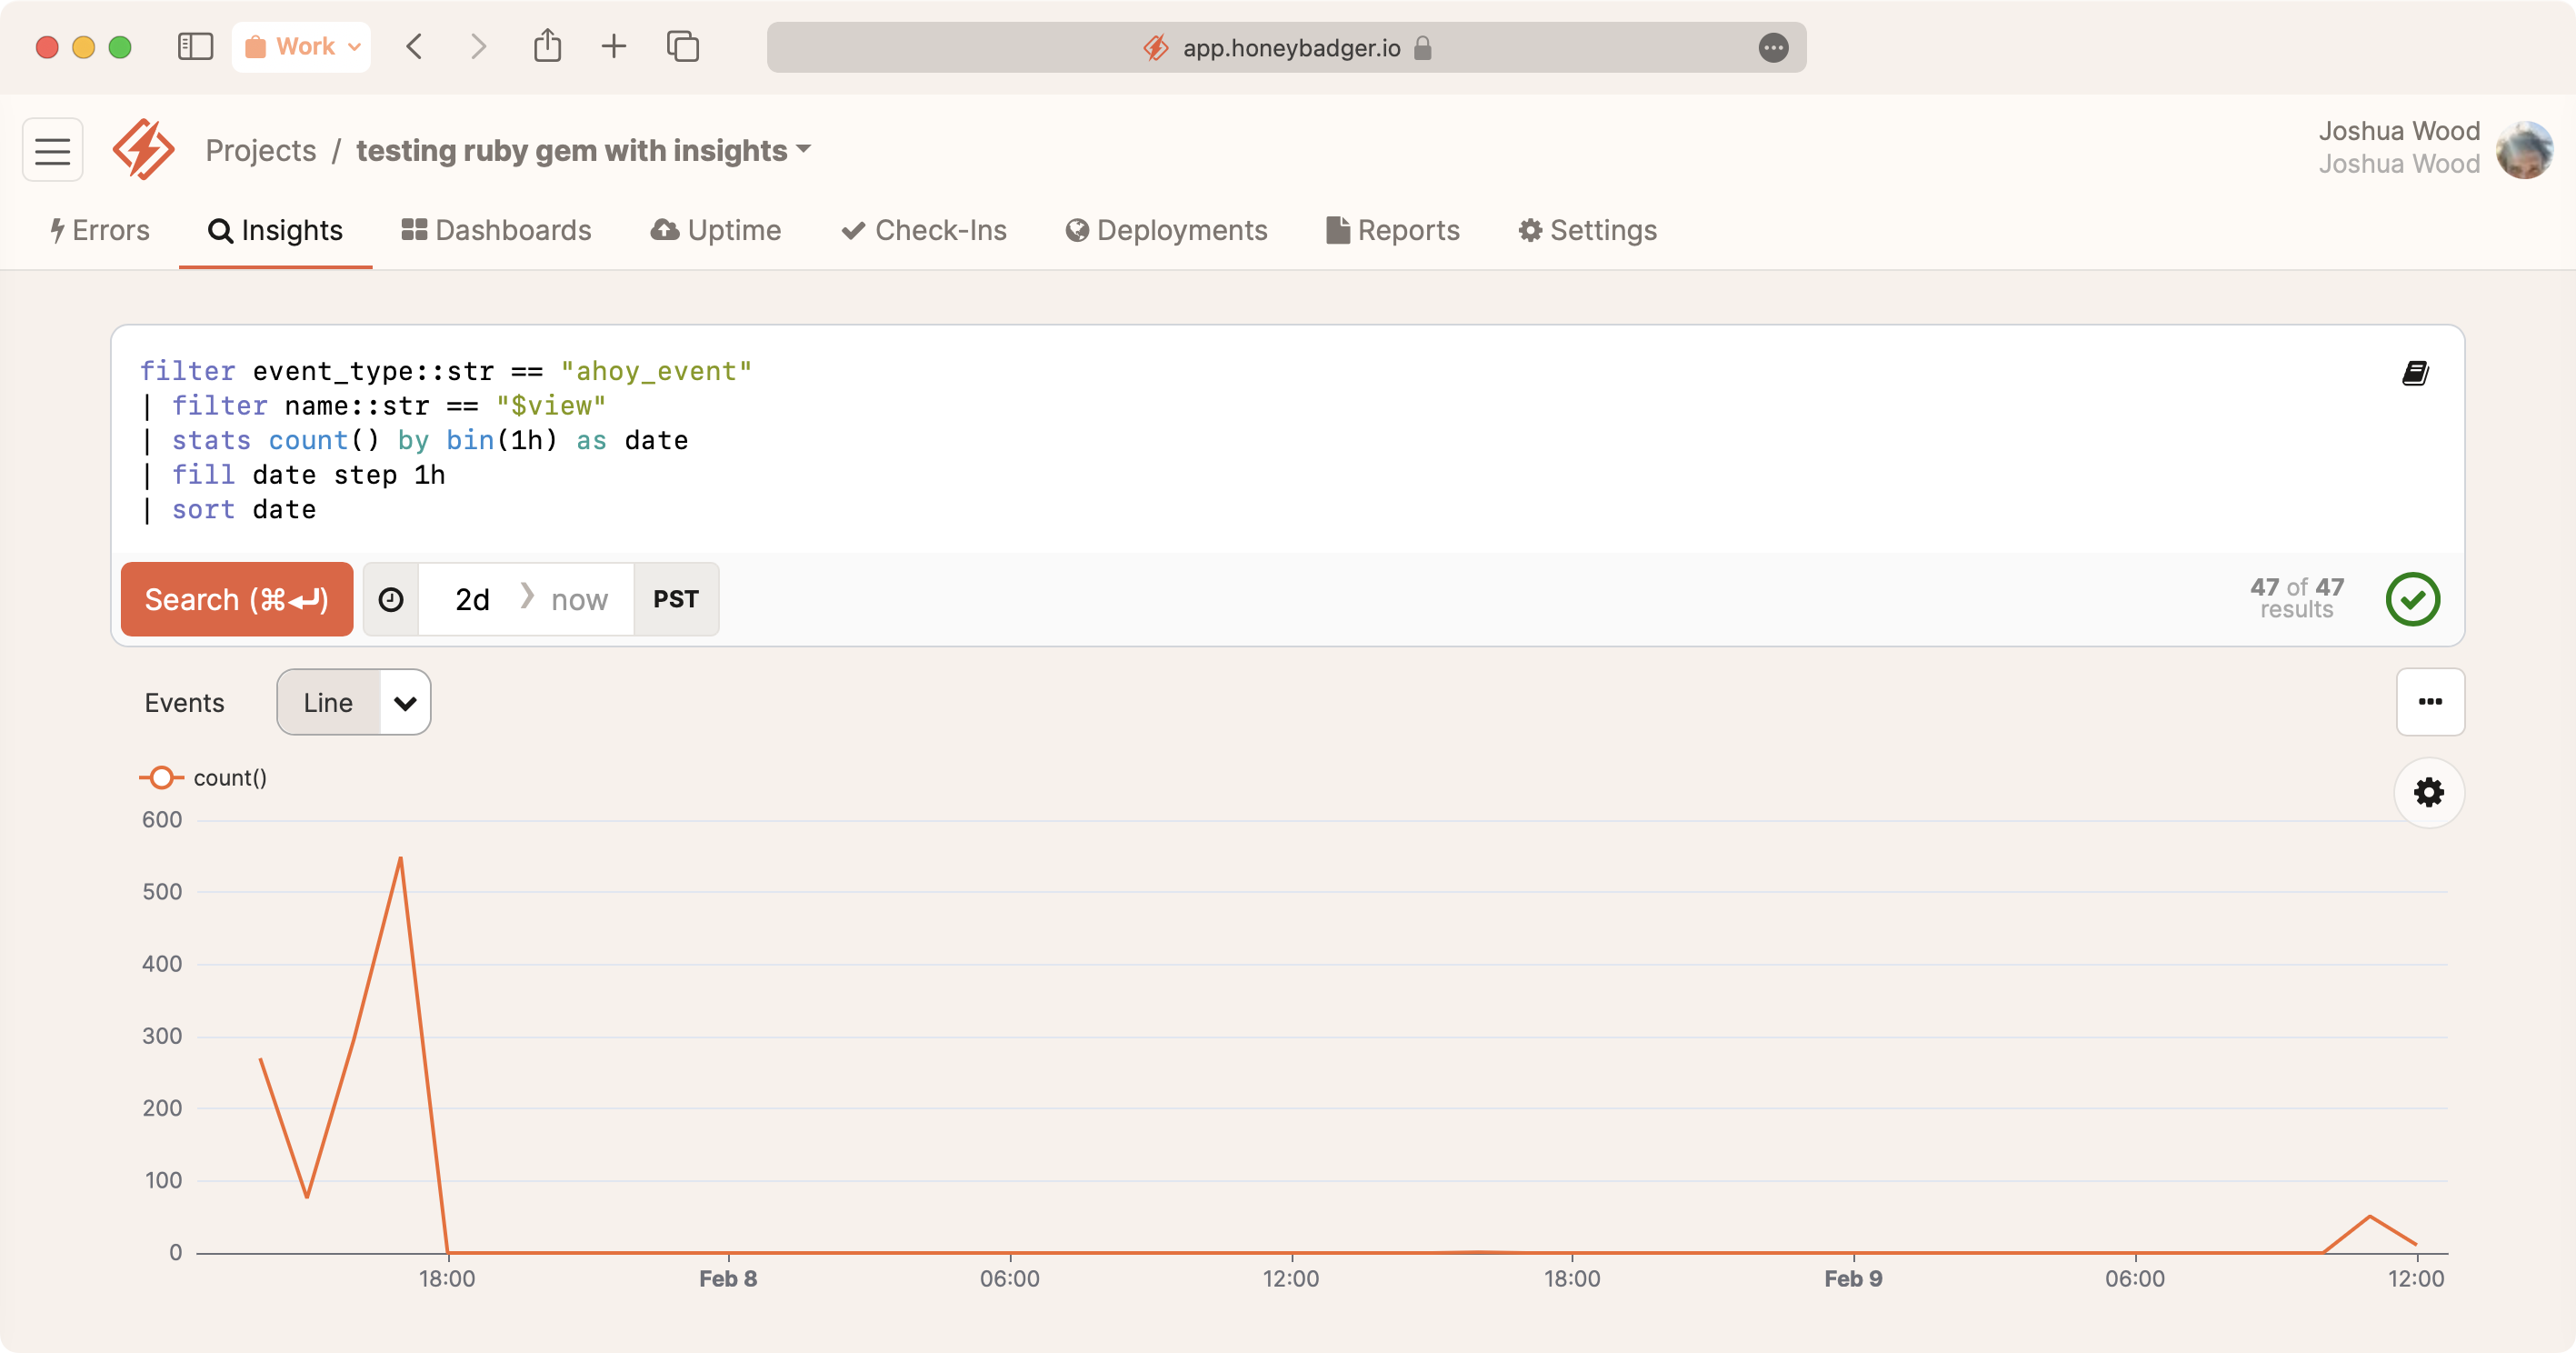
Ahoy chart in Honeybadger Insights

Sending our Ahoy data to Insights means we can query our web/product analytics and user events in the same place as our observability data. It's a significant upgrade for product-led teams like ours. If that sounds like you, check it out!

What to do next:
  1. Try Honeybadger for FREE
    Honeybadger helps you find and fix errors before your users can even report them. Get set up in minutes and check monitoring off your to-do list.
    Start free trial
    Easy 5-minute setup — No credit card required
  2. Get the Honeybadger newsletter
    Each month we share news, best practices, and stories from the DevOps & monitoring community—exclusively for developers like you.
    author photo

    Joshua Wood

    Josh is Honeybadger's resident bug hunter and technical debt collector. Once enthusiastically referred to as a "human exception tracker", he spends his days crafting the middleware, plugins, and gems which keep the 'badger fat and happy through a steady diet of fresh data.

    More articles by Joshua Wood
    Stop wasting time manually checking logs for errors!

    Try the only application health monitoring tool that allows you to track application errors, uptime, and cron jobs in one simple platform.

    • Know when critical errors occur, and which customers are affected.
    • Respond instantly when your systems go down.
    • Improve the health of your systems over time.
    • Fix problems before your customers can report them!

    As developers ourselves, we hated wasting time tracking down errors—so we built the system we always wanted.

    Honeybadger tracks everything you need and nothing you don't, creating one simple solution to keep your application running and error free so you can do what you do best—release new code. Try it free and see for yourself.

    Start free trial
    Simple 5-minute setup — No credit card required

    Learn more

    "We've looked at a lot of error management systems. Honeybadger is head and shoulders above the rest and somehow gets better with every new release."
    — Michael Smith, Cofounder & CTO of YvesBlue

    Honeybadger is trusted by top companies like:

    “Everyone is in love with Honeybadger ... the UI is spot on.”
    Molly Struve, Sr. Site Reliability Engineer, Netflix
    Start free trial