Have you ever tried to debug your Ruby code by typing in print statements and hoping they’d eventually show up where they should? You know what I mean - you type puts “This worked!" into the code and then run it in the terminal, only to have nothing show up.
Or maybe you’ve heard of the fancy debugging tools available to Ruby developers but have been afraid to try them. So instead you go for the spaghetti method of debugging: throw code at your text editor and see what sticks. The problem is that this method doesn’t guarantee a solution.
Debugging is something you’re going to be doing for the rest of your coding life. It’s not just for junior developers! The sooner you learn how to use Pry and other tools to help you find the bugs in your code, the better off you’ll be in the long run.
So what are the tools out there? While there are many choices, today we’re going to pry into one of the great tools every Rubyist should know how to use - Pry. We’ll learn how it works and why it’s important.
What is Pry?
Pry freezes your program so you can get inside your code and find out what’s going on and what needs fixing. Pry can look confusing at first, but take it from a fellow junior Ruby Dev - it gets easier the more you use it, and soon you’ll never want to program without it.
Pry is like IRB on steroids
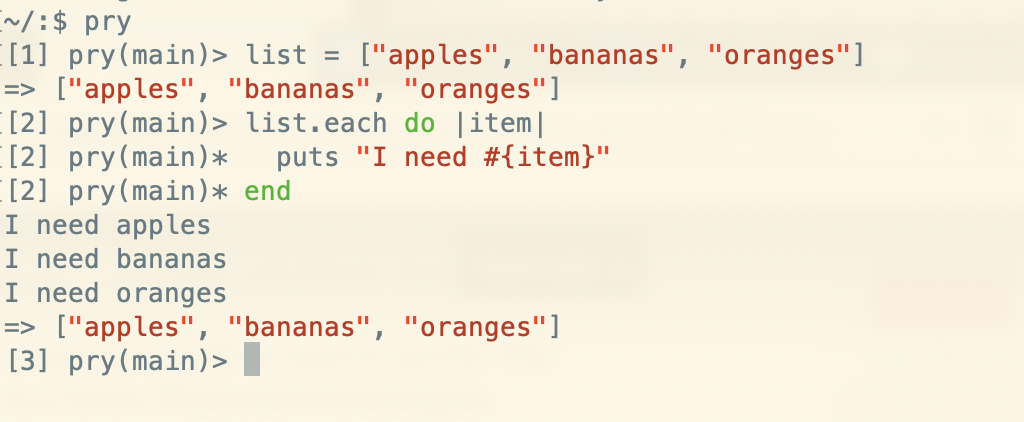
Chances are, you’ve grown comfortable using IRB (Interactive Ruby Shell) where you can take your code and run it in a playground to find out what works and what doesn’t. It can also be a useful tool for debugging. Part of Pry works similarly but with added features. Both IRB and Pry use REPL commands: Read, Evaluate, Print, and Loop. But Pry commands allow you to go further when debugging. For example, Pry gives you color-coded syntax, which helps when you’re trying to figure out what will happen when code is executed. It makes mistakes easier to spot, which makes your code easier to fix.
Sample code
A note about debugging
It’s been said already, but it’s worth saying again - debugging is something that all programmers do throughout their careers. There’s nothing junior about learning these tools at all! So the sooner you learn them, the better a programmer you’ll be.
How to use Pry with breakpoints
Now it’s time to look at one of the very best features of Pry - setting breakpoints in your code. Let’s say you’re having a really hard time getting your code to run the way you expected. (We’ve all been there, right?)
What you can do is set a breakpoint in the part of the code that isn’t working as expected and then you’ll end up in a version of Pry, but at a point that is frozen. The best way to explain this is with an example.
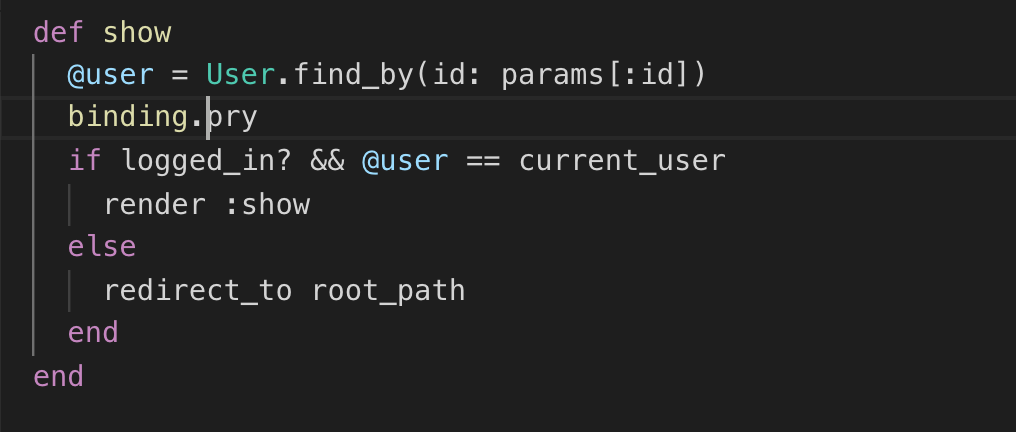
Suppose we're trying to find out if the user we want to view is set properly. First, we can add our binding.pry into the code. Set the binding.pry right above the line of code that is causing the trouble and then run the code.
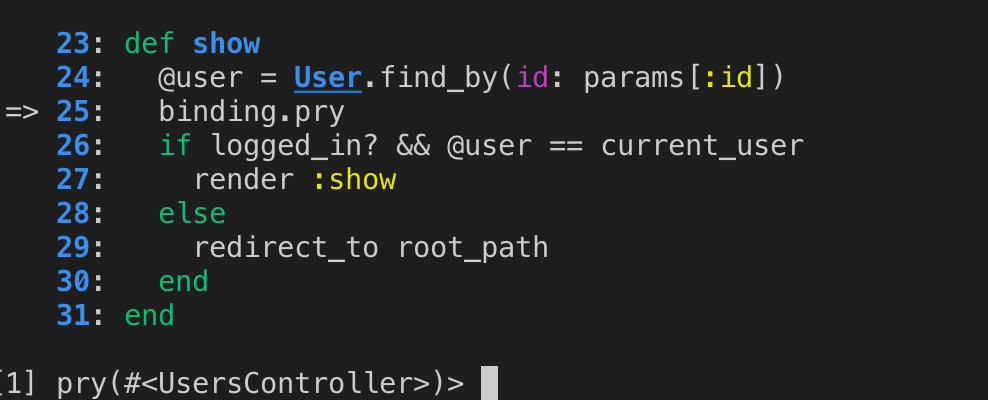
Next, we try hitting the page that will trigger this code. Since we're running the rails server locally, we'll try going to: localhost:3000/users/1
You’ll find that you land in an IRB-like console where you can test out your code and see what’s happening.
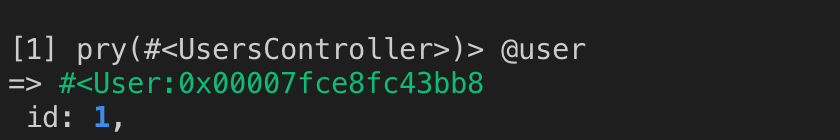
At this point, we're able to check whether @user is set to the right user ID.
We can also check whether our user is logged in:

What if nothing happens?
Sometimes you’ll make some breakpoints, run your Ruby program, and then instead of landing inside Pry, nothing happens. While this may be frustrating, it does give a clue. It means that your code never triggered the Pry because it never got that far. So what do you do? You set a new breakpoint earlier in the code and see if that works. While this may seem tedious, it is actually giving you important information!
Advanced Pry techniques
For many situations, setting a single breakpoint and poking around variables is enough to find where the problem is. But sometimes you need to go deeper. Once you’ve gotten comfortable with the fundamentals of Pry, it’s worth exploring some of its more helpful features.
Navigating around your code
One of Pry’s most meaningful aspects is its set of built-in Pry commands for navigating your code. You're not stuck where your breakpoint catches. For example, the whereami command displays the location in the code where your Pry session is paused and shows a few lines of the surrounding context. This is a quick way to refresh your memory on what your method or class is doing without having to open the file in a separate editor.
If you ever need to step into a different scope (like a class or module), you can use Pry’s cd command. Typing cd SomeClass changes Pry’s current context to SomeClass, making it easier to inspect methods or constants defined there. To go back up a level, just type cd .., like in bash.
Exploring documentation
If you’d like an even deeper dive into a method's implementation, you can install the pry-doc gem to gain access to Ruby’s core documentation directly in Pry. This is great for referencing built-in methods or classes without leaving your debugging session. You can install it by adding it to your Gemfile or by running:
gem install pry-doc
Then, to have pry-doc automatically loaded when you're starting pry, add it to your pryrc file:
require 'pry-doc'
Then, from within pry, you can use pry-doc to see a method's documentation:
pry(main)> show-doc Array#map
Stepping through code with pry-byebug
Sometimes you need finer control over program execution. That’s where the pry-byebug gem comes in handy. Once installed, it enables commands like step, next, and continue, mirroring a traditional debugger’s functionality. If you suspect a bug is hiding inside a method you just called, you can use step to move into that method line by line. If you’re fairly confident in the flow but just want to skip ahead, next will step over methods. Finally, continue resumes normal execution until you hit another breakpoint—or the end of the program.
By getting more comfortable with some of these advanced Pry techniques, you’ll make your debugging sessions more efficient and your exploration of Ruby’s internals more insightful. From navigating large codebases to stepping through logic line by line, Pry’s deeper toolset offers a robust way to uncover and fix even the most elusive bugs.
Ruby's newer built-in debugger
Starting with Ruby 3.1, there is a newer built-in debugger named debug (shipped as part of the standard library) that offers capabilities similar to byebug. Because of this, some folks have moved away from byebug in favor of debug. However, pry-byebug still works for many Ruby versions and remains popular with developers who have used it for years. If you’re on Ruby 3.1 or newer and want to use the official debugger, you can explore debug.
When to ask for help
As a relatively newer Ruby programmer, sometimes you'll need to ask a more experienced software developer for help. The problem often comes in deciding when to keep debugging and when it's time to reach out for help. When debugging, it's a good idea to try replicating the problem. Set your breakpoints with Pry and dig deeper into the code. If after 20-30 minutes you're no closer to finding a solution, it might be time to ask for an extra hand.
Give Pry a try
Now that you know how to use Pry, you're ready to add it to your arsenal of debugging tools. You'll need to do a couple of things. First, you'll need to install the gem. You can do this by adding it to your Gemfile:
gem 'pry', '~> 0.15.0'
Then, run Bundler:
bundle install
Alternatively, you can manually install it with:
gem install pry
You'll also need to make sure your code is expecting Pry, so place this line in your file:
require 'pry'
And that's it! You're up and running with Pry!


