Full-stack logging & observability

See the forest for the trees

Gain insights into your errors, application logs, and other event streams with a powerful query language and flexibile visualizations.

BadgerQL
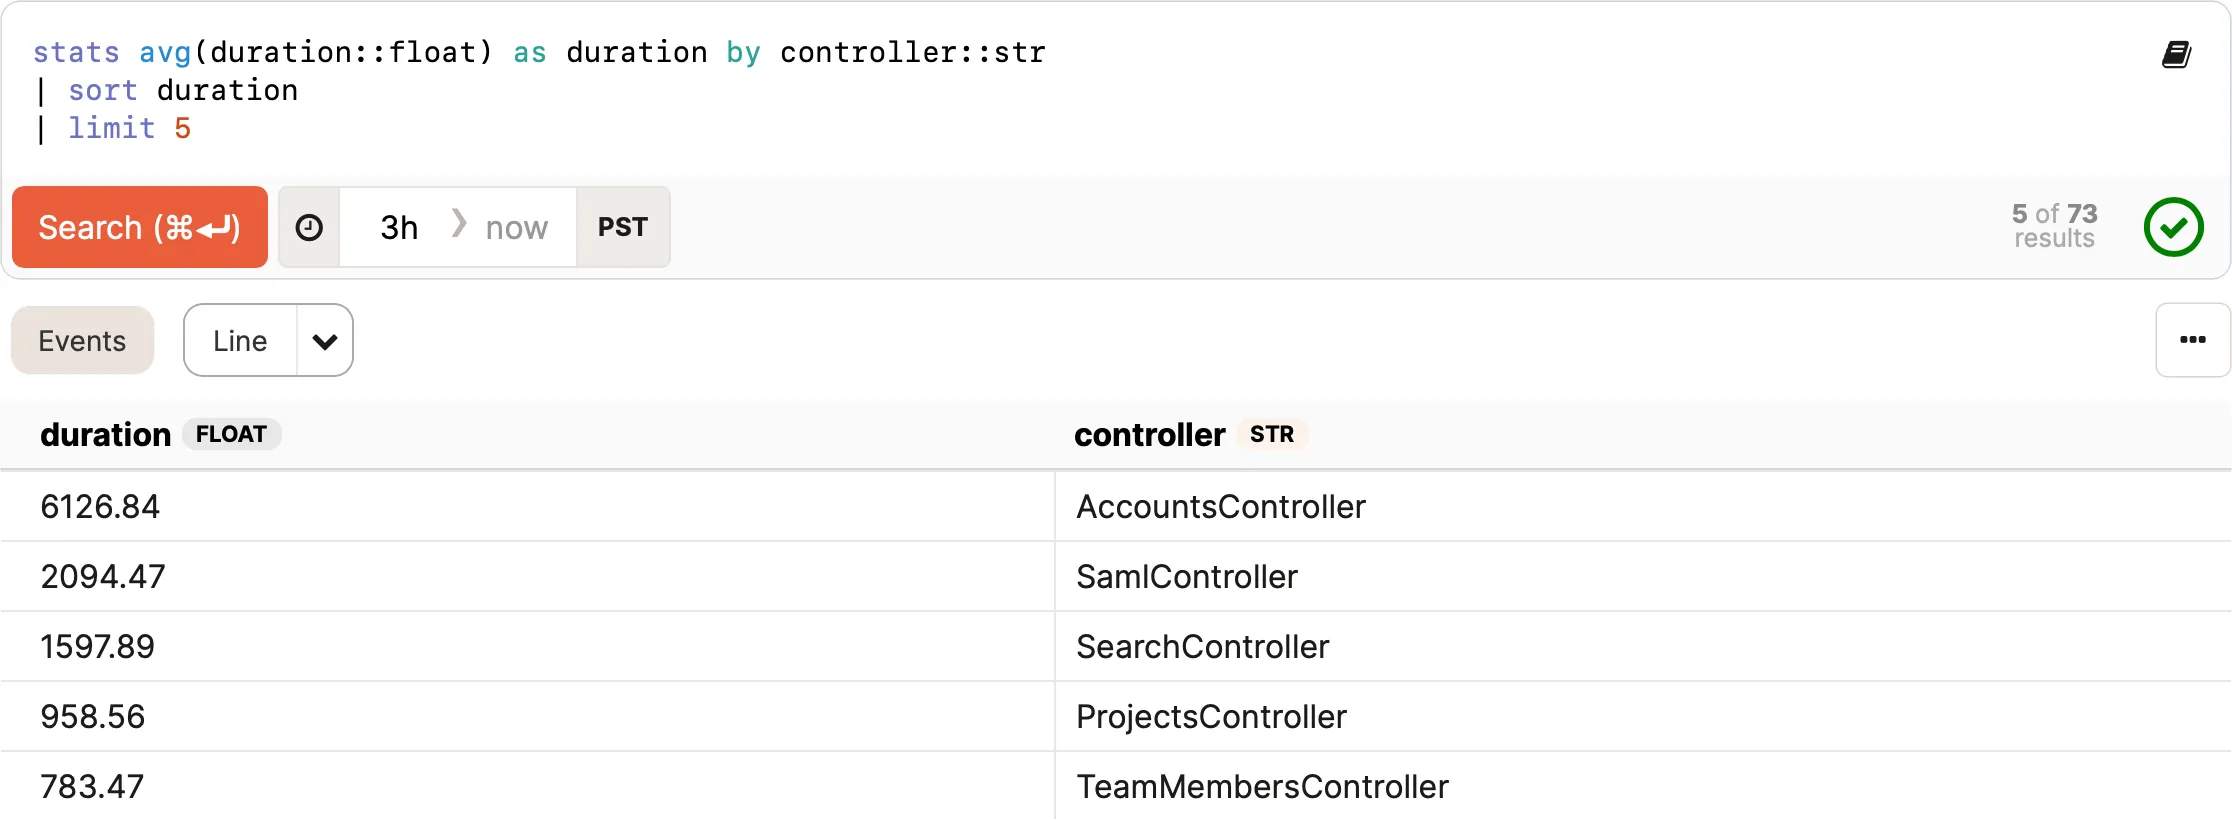
filter event_type::str == "feature"
| stats unique(user_id::int) as count by name::str
| sort count
| limit 5
4 lines
A squiggly arrow pointing down
A squiggly arrow pointing right
A stacked chart showing top used features

Turn events into Insights

Get actionable intelligence from your logs, no tail required. Who wants to sit around tailing logs all day? All the events you send to Honeybadger Insights can be queried, analyzed, and even turned into metrics. Application logs, clickstream data, audit trails—you name it—squeeze the value from the volume!

A log data table from an application monitoring tool with timestamps in PST. The entries display JSON data with actions like "links", "show", "index", "hook", "poll", executed by controllers such as "SearchController", "TasksController", "ProjectsController", "GithubController". Database query times and request durations are logged, indicating performance metrics, with several actions taking over 100 milliseconds. Logs include AWS ECS task references, suggesting this application is containerized and deployed on AWS ECS.

Logs? Metrics? Traces? Wide Events

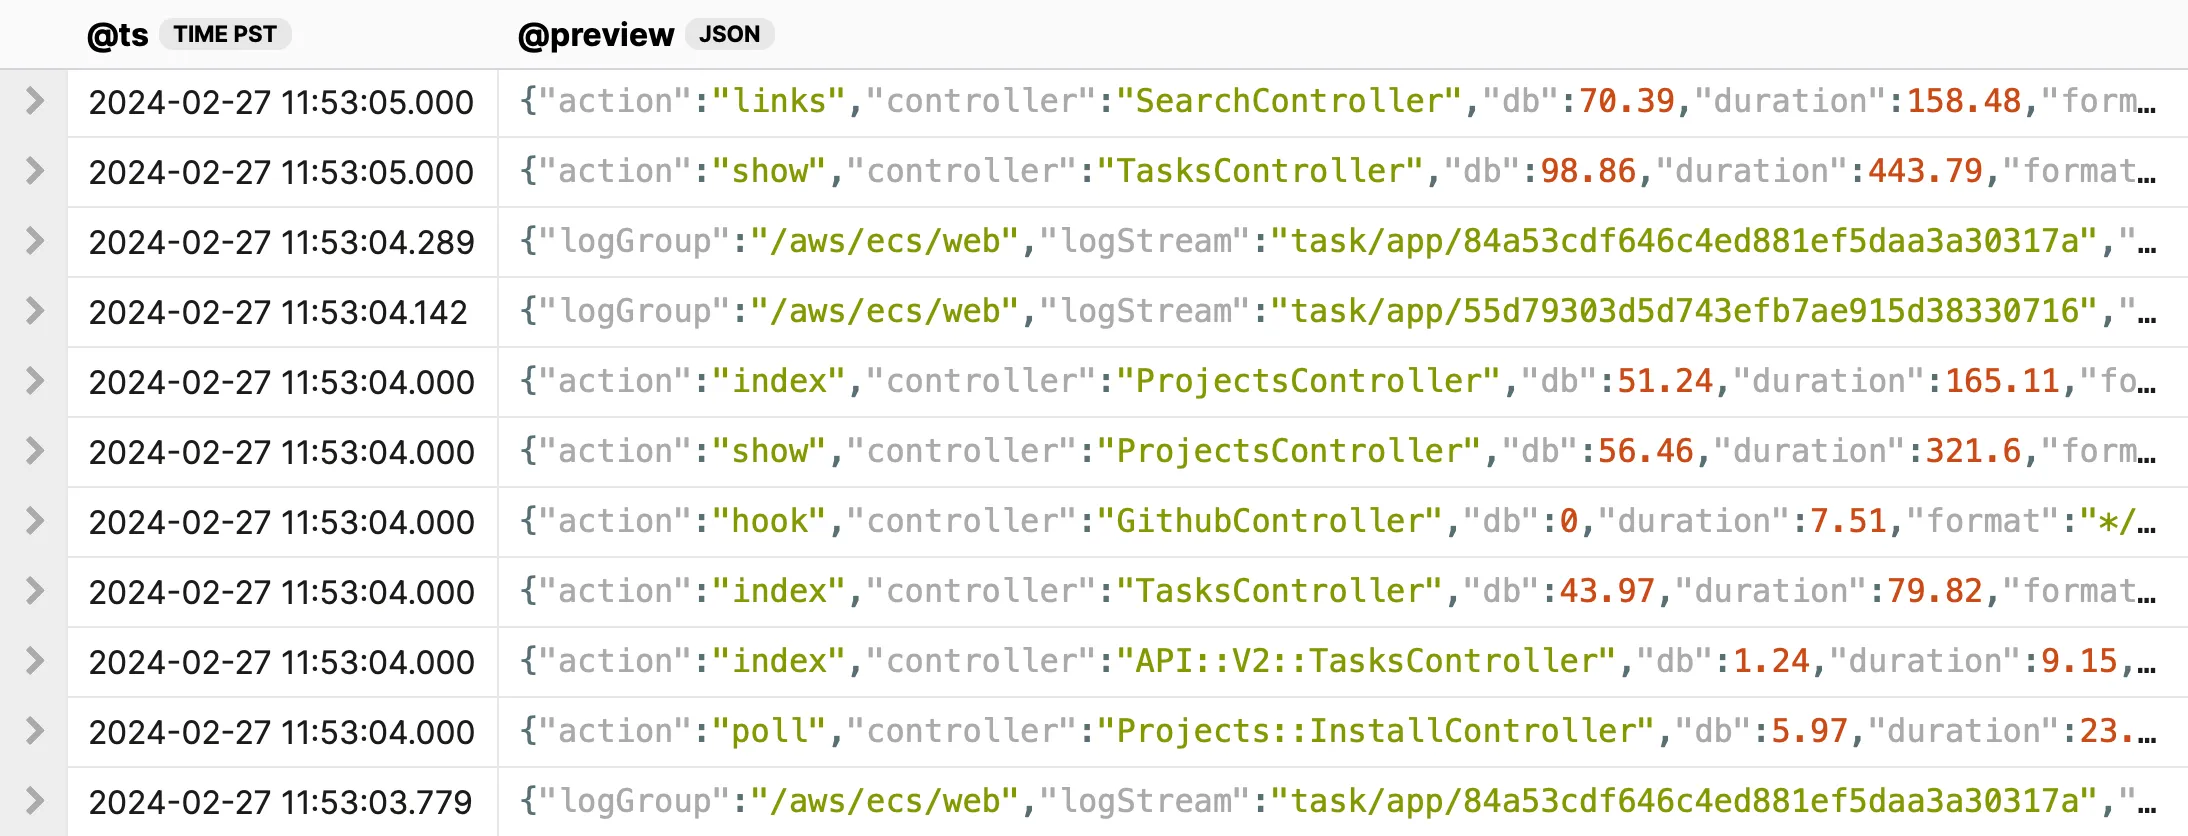
No one knows what Observability means anymore, and we're not sure they ever did. Forget logs, metrics, and traces—you need Wide Events. A Wide Event is a collection of properties that may be useful later (the more, the better). They're the best way to prepare for unknown unknowns — the things you can't anticipate before an incident.

In Honeybadger, everything is an event, not just the big three. User behavior, business intelligence, analytics—imagine the possibilities when everything is cross-correlated and stored in one place.

Uncover why that happened

Get fast answers to your questions with BadgerQL. Slowest requests today? Most common errors? Who signed up last weekend? BadgerQL is a powerful query language that lets you slice and dice your events to find the needle in the haystack.
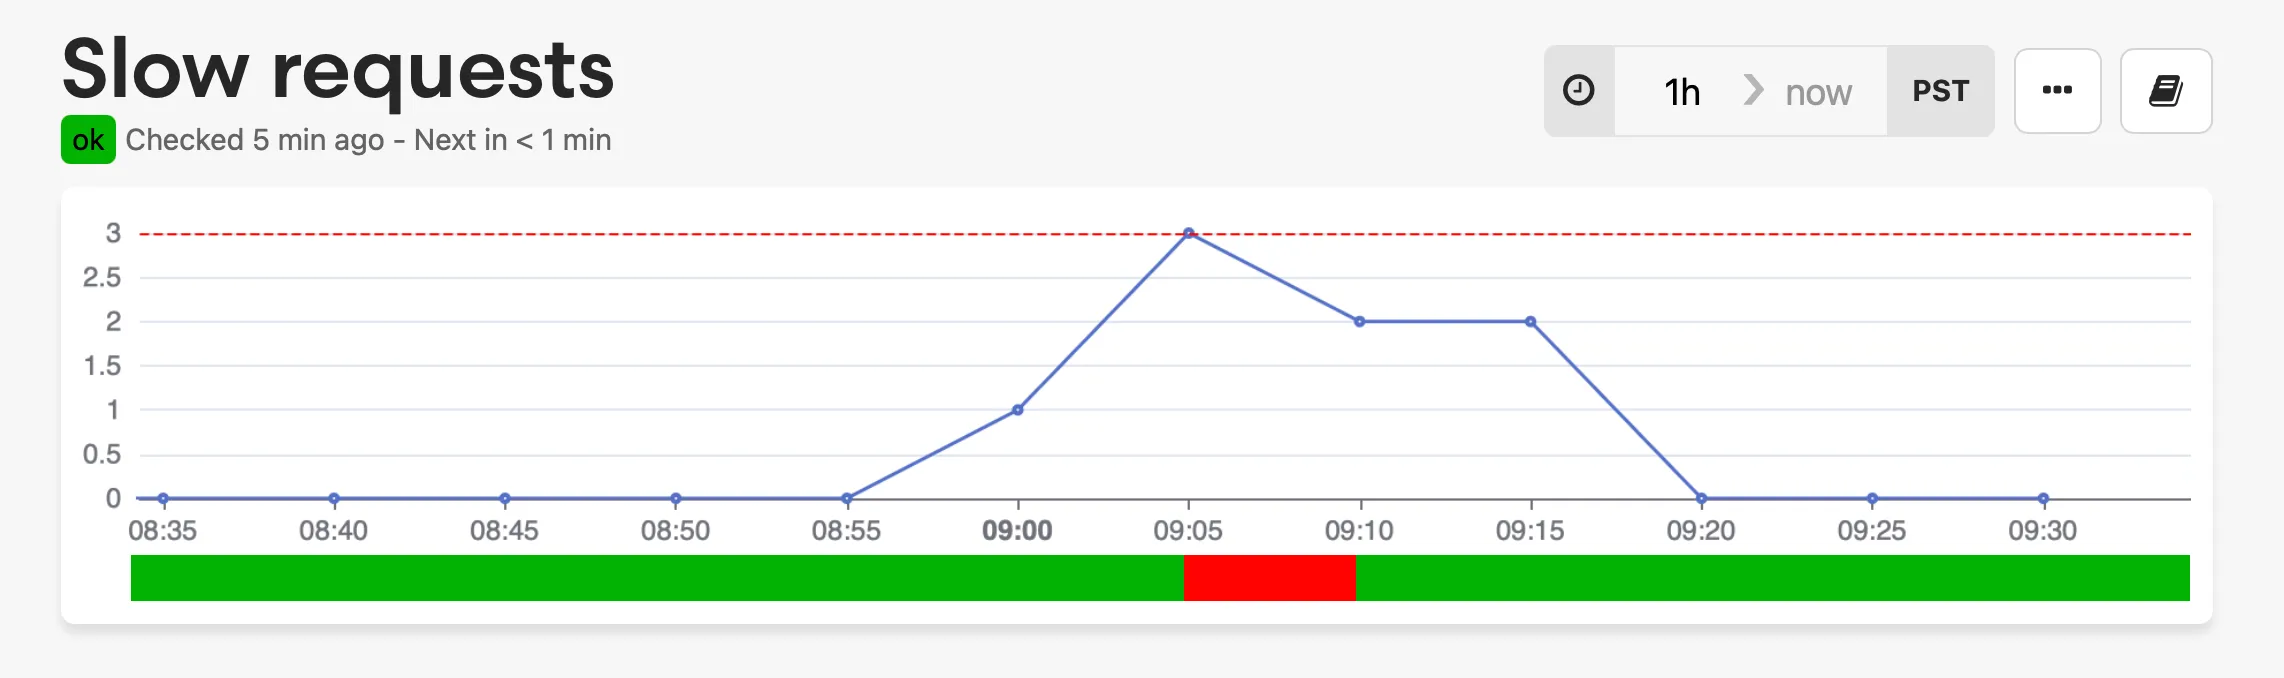
A data table showing the average request duration in milliseconds for different controllers in a web application. The 'AccountsController' has the highest average duration of 6126.84 ms, followed by 'SamlController' at 2094.47 ms, 'SearchController' at 1597.89 ms, 'ProjectsController' at 958.56 ms, and 'TeamMembersController' at 783.47 ms. The search query used to generate this table is visible above the results, including commands to calculate the average duration, sort by duration, and limit the output to 5 entries.

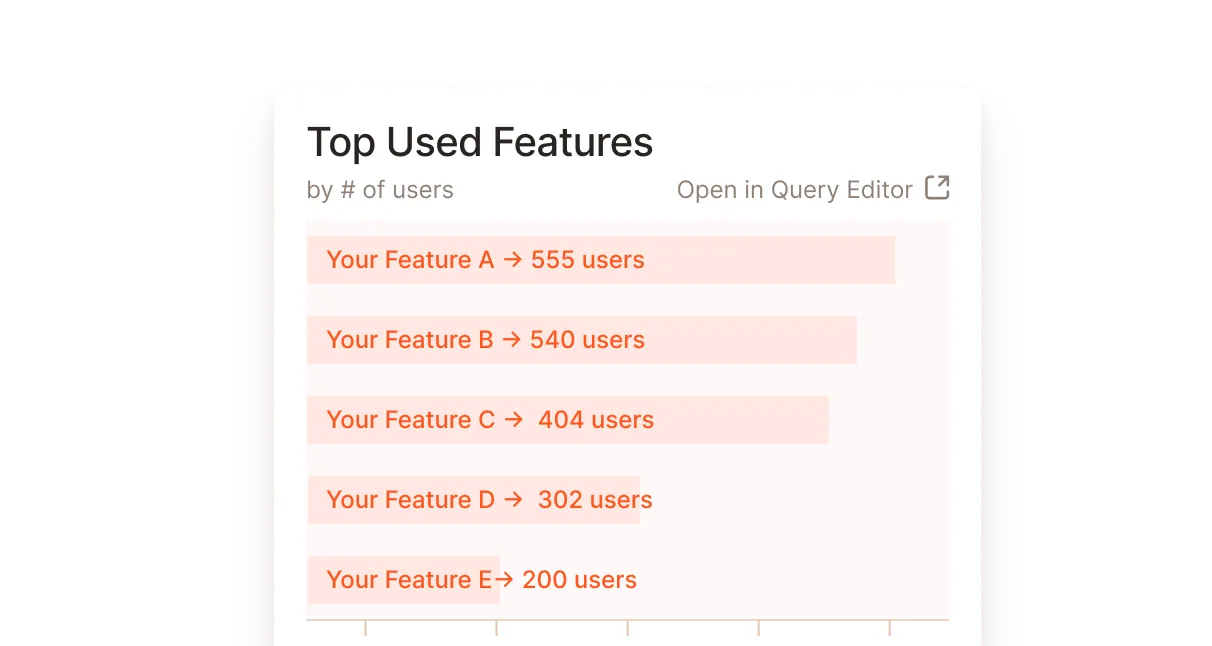
See the bird's-eye view

Derive metrics from any event and create charts and dashboards.

Six performance metric graphs for a web application: "API requests" shows stable request counts, "API response time" fluctuates with spikes, "Ingest throughput" varies with an upward trend, "Ingest performance" has peaks under 0.4 seconds, "Notifications throughput" demonstrates volatility, and "Notifications performance" maintains a steady average time around 0.18 seconds, all over 15-minute intervals. Options to edit queries suggest customizable monitoring.

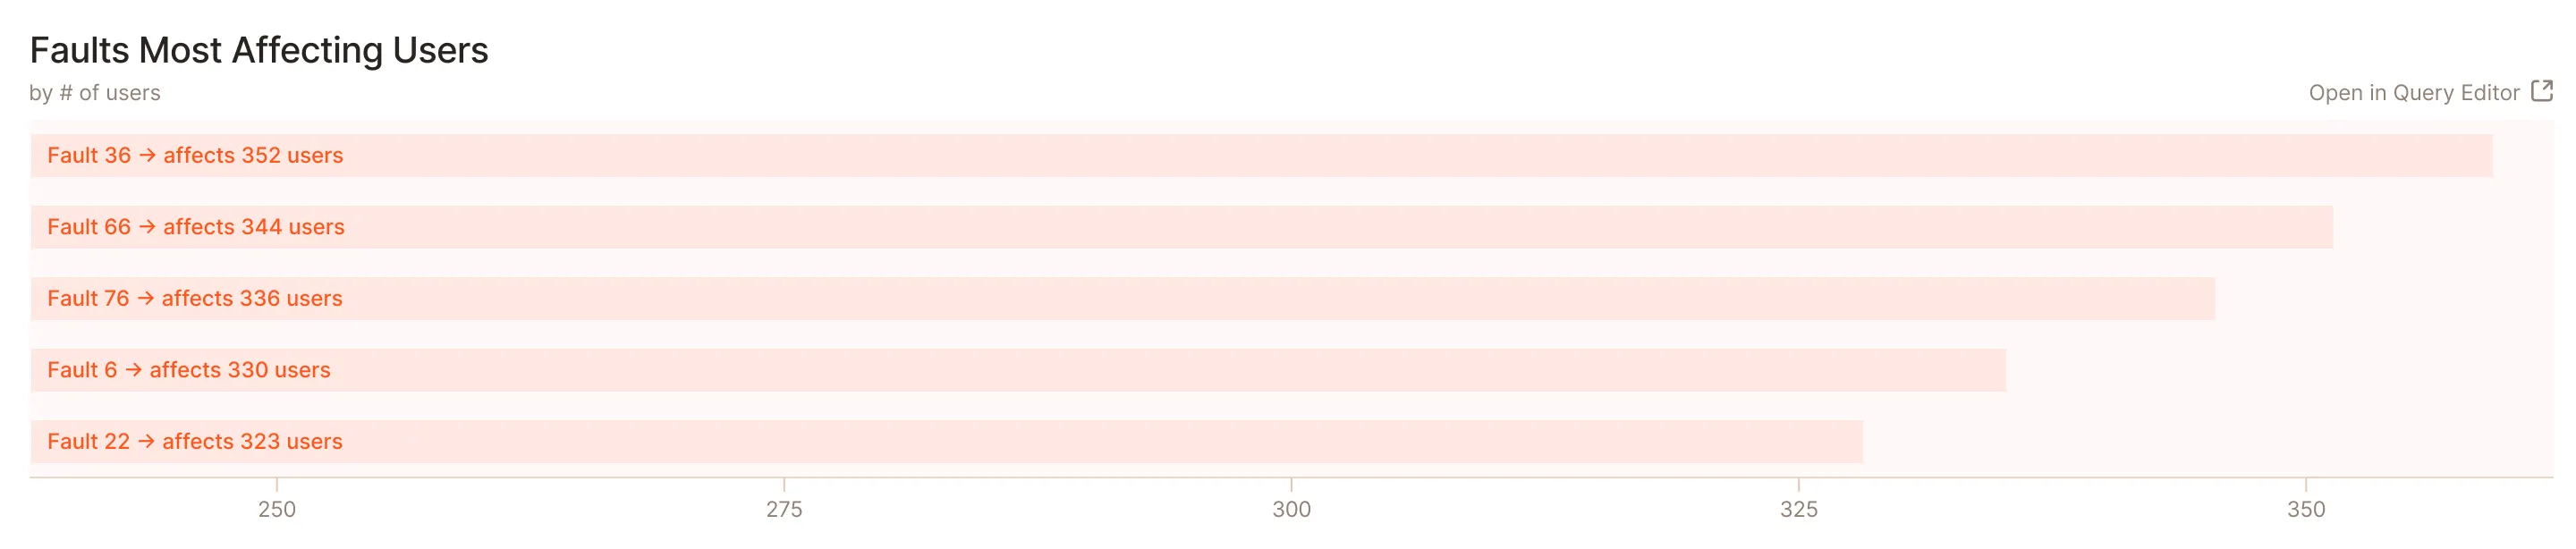
Spot catastrophes before they happen

Get ahead of potential issues. We’ll show you the warning signs before it becomes an all-hands-on-deck emergency.

A frequency chart showing notice volume over time.

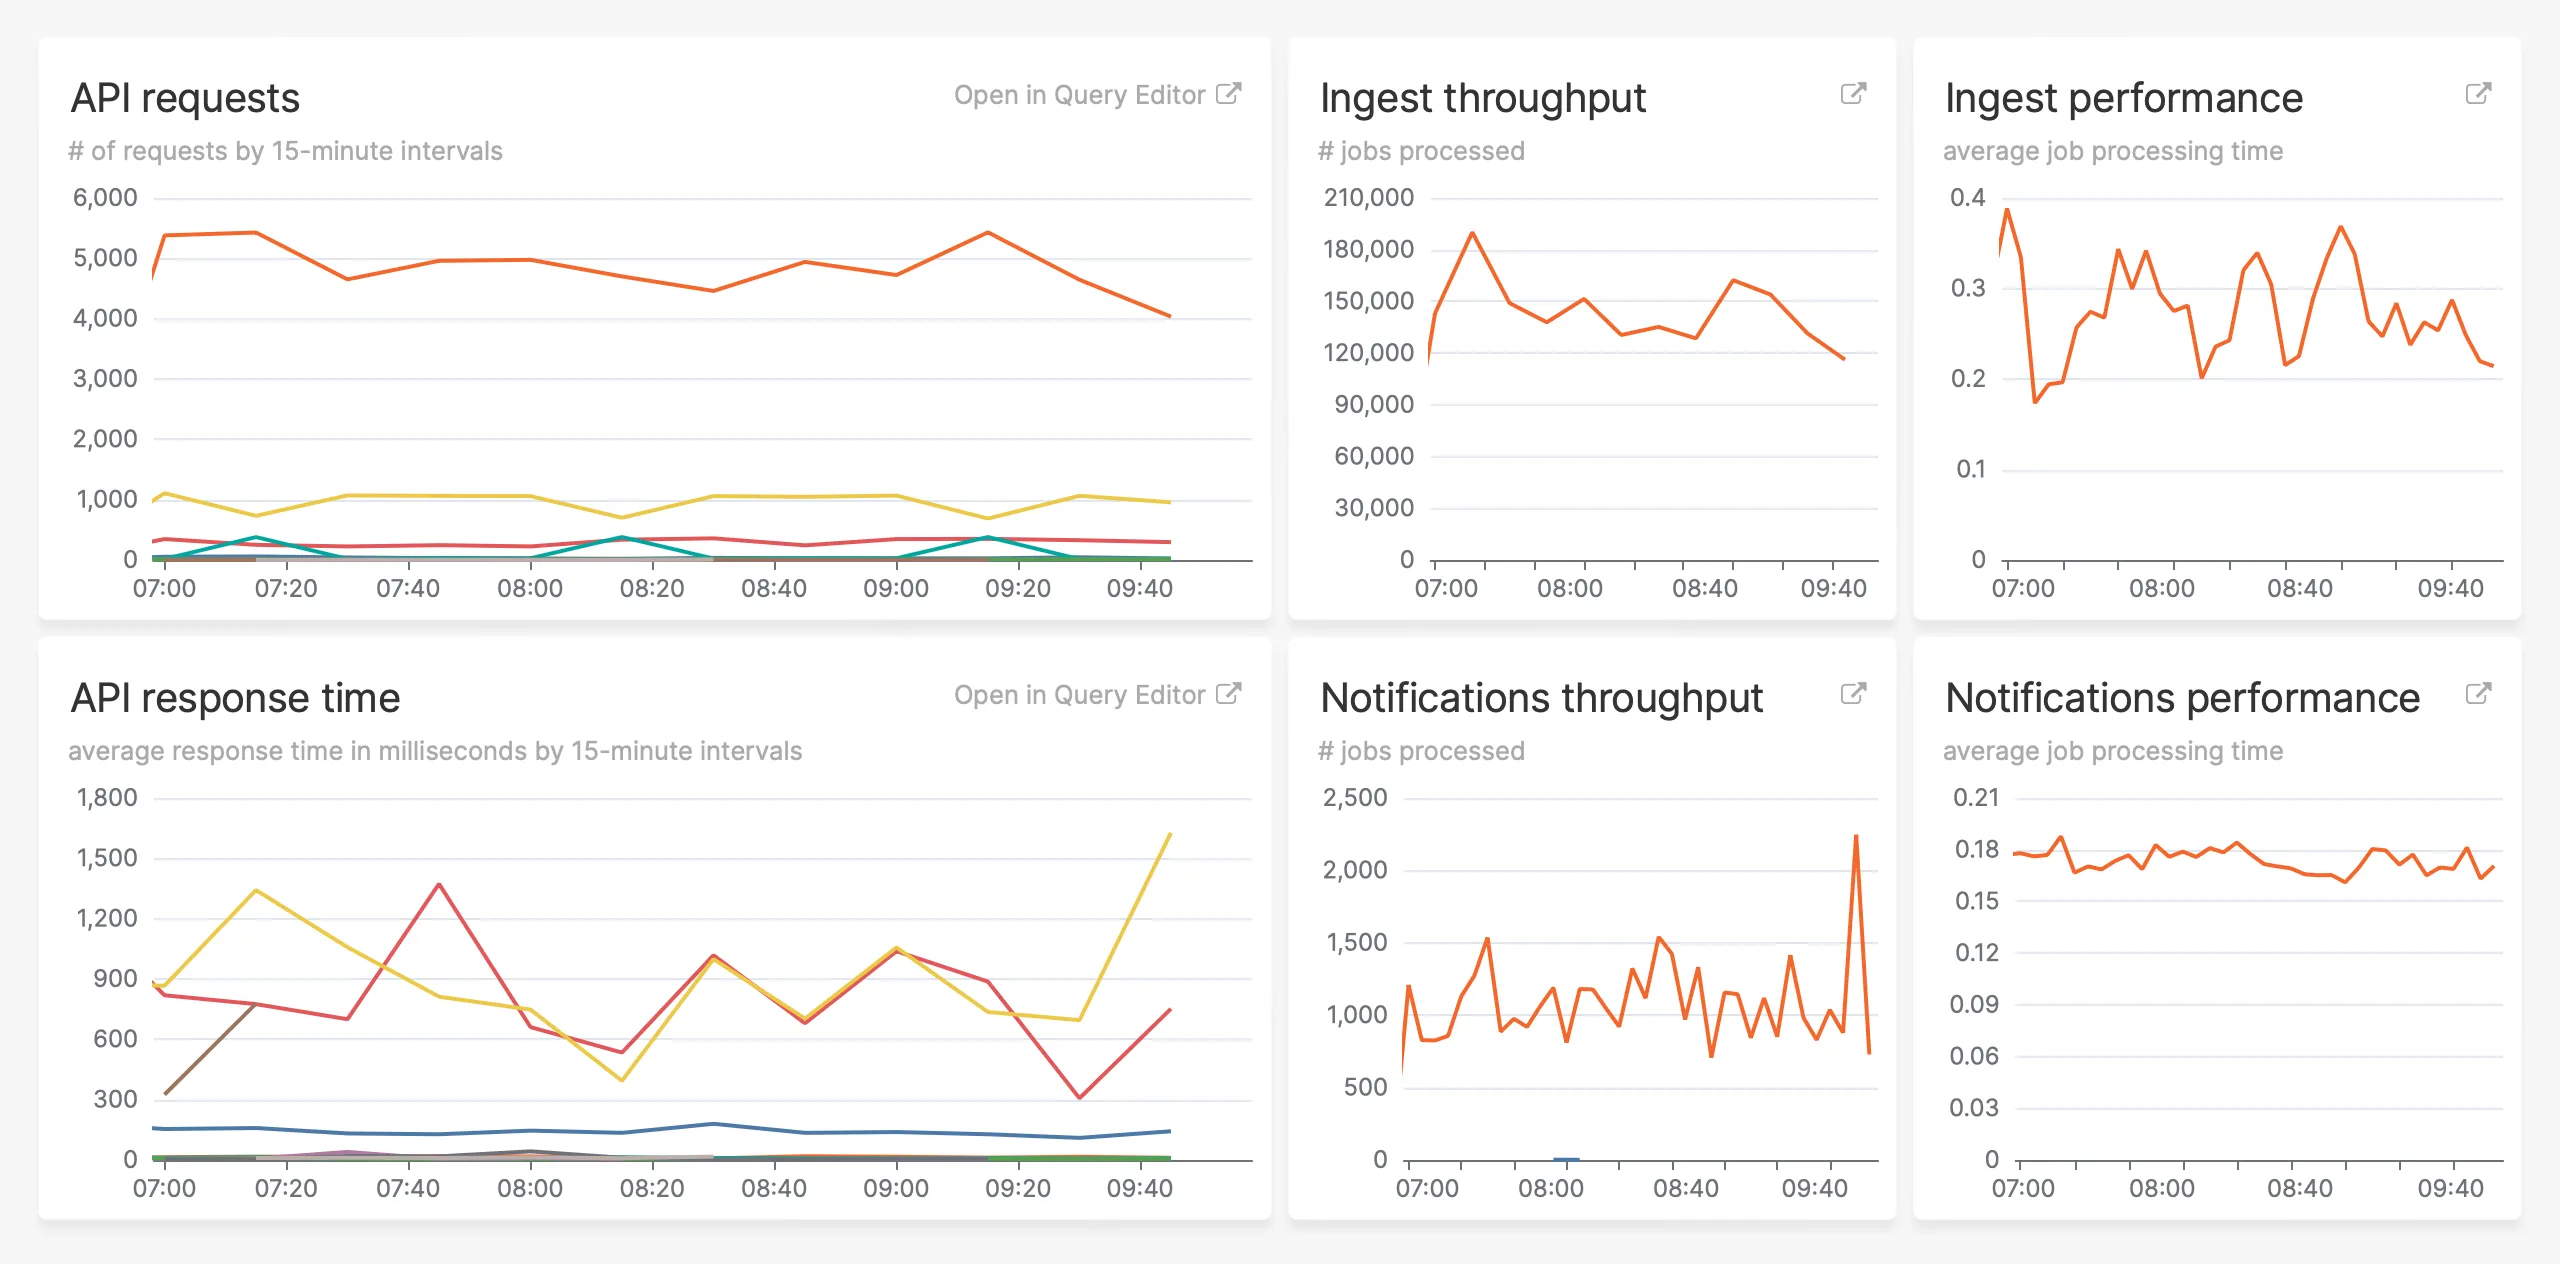
Honeybadger, supercharged

Honeybadger Insights comes pre-filled with dashboards for errors, uptime checks, and check-ins. Use it to gain immediate insights into your application's health and performance—then send your application logs to gain even more context.

A horizontal bar chart titled "Faults Most Affecting Users" lists five faults by the number of users affected. The bars represent the number of users, with Fault 36 affecting 352 users, Fault 66 affecting 344, Fault 76 affecting 336, Fault 6 affecting 330, and Fault 22 affecting 323. The chart has a range up to 350 users and includes an option to "Open in Query Editor," indicating the data is interactive and part of an analytic tool.

How will you use Insights?

Insights is versatile—like a Swiss Army knife for your data. How will you use it? Here are a few ideas to get your started.

Application Performance Monitoring

Add instrumentation to your app to track API call durations, background job latency, etc., and send those metrics as log events.

Customer Lifecycle Analysis

Track and analyze customer behavior and lifecycle events, like sign-up rates, feature usage, and other events you care about to support your marketing team.

SaaS Billing Analysis

Send your billing events to Insights and create revenue dashboards, monitor sales trends, and discover which features drive upgrades.

Correlated Event Tracking

Use a correlated trace ID to track all events related to a particular request, providing a comprehensive view of what happens during that request's lifecycle.

CI/CD Pipeline Monitoring

Track events from your build pipeline, such as a count of failed tests, test run durations, and deployment time, to monitor the health of your CI/CD pipeline.

Privacy-First Web Analytics

Use an open source analytics library such as ahoy.js to collect web analytics, explore your data in one place with BadgerQL, and create custom dashboards.

 
Ship us your logs, get Insights

Cut through the noise

See the bigger picture, put things into context & detect anomalies before they become catastrophes.