 By
By The ability to record and see everything happening across your web applications is essential when building resilient and highly available systems. All of your events—from application logs to errors to user behavior—contain data that could be useful to you and your team. When you have a central place to access all this information, finding issues and their root causes becomes easier because you have the data at your fingertips. At Honeybadger, we're making that easier for everyone with our new observability platform, Honeybadger Insights. While you can send many things to Insights, logging is one of the quickest wins with the most gain.
In this tutorial, we'll deploy a Rails application to production with Kamal, with structured application logs sent to Honeybadger Insights. If you want to skip ahead and see the final result, I've posted the source code I used to create this tutorial here: github.com/roelbondoc/rails-kamal-vector.
Requirements
You'll need a few things before getting started with this tutorial:
- Rails application
- Docker registry for pushing images
- Server to deploy your service
- Honeybadger account, it's free!
Generate a new Rails application
To follow this tutorial, you'll need a Rails application. If you'd like detailed instructions on how to create one, the Getting Started guide on the Ruby on Rails website is a great resource. Here's a quick breakdown of how to do that if you need a refresher:
First, ensure you have a recent version of Ruby installed. You can check this by running the following in a terminal:
ruby -v
This will return the version currently installed on your system. At the time of this writing, you'll need at least version 2.7.0 or higher.
Install the rails gem:
gem install rails
And generate a new Rails application:
rails new my-app
Configuring Rails logs
By default, Rails outputs logs using a plain unformatted formatter. This is fine in development when building your application and examining log output for debugging purposes. However, you'll want to introduce structured logging to make the most of an observability platform. With structured logs and a service to store them, logging becomes extremely powerful as part of your observability toolbelt. One way to do this in Rails is by using the Lograge gem.
Add the gem to your Rails application:
bundle add lograge
Configure the logging in your production.rb file:
config.logger = ActiveSupport::Logger.new(STDOUT)
config.lograge.enabled = true
config.lograge.formatter = Lograge::Formatters::Json.new
By enabling Lograge with a JSON formatter in your Rails app, you'll get to take advantage of any values passed into your logs. Notice how the logger is configured to output to STDOUT. This will output the logs to the Docker daemon. We'll use Vector to read those logs and ship them off to Honeybadger.
Kamal
Kamal is an open source deployment strategy created by the folks at 37Signals. You can think of Kamal as the successor to Capistrano. The great thing about Kamal is that it takes advantage of container-based deployments but wraps everything up in easy-to-understand commands.
If you are using the sample application above, you'll see a .env.sample file in the repo. Make a copy of this file with the name .env in the same directory location. Modify the KAMAL_REGISTRY_PASSWORD with the password for your docker registry service. Next, replace the following fields in the config/deploy.yml file:
<your registry path>- This would be the URL path of where you will push your images.<your registry username>- The username you use to log into your registry.<your server ip address>- The destination server to which you will deploy our application.
If you are setting up Kamal on your own application for the first time, take a look at my previous article for more information about configuring Kamal.
After successfully configuring Kamal, you should be able to deploy your application like this:
kamal deploy
Kamal Accessories
In Kamal, accessories aren't part of your Rails app but rather run alongside your Rails app. These can be things like cache services, databases, or other external appliances. Adding Vector as an accessory is pretty simple.
Add the following to the bottom of your deploy.yml file.
accessories:
  vector:
    image: timberio/vector:latest-alpine
    roles:
      - web
    volumes:
      - /var/run/docker.sock:/var/run/docker.sock
    files:
      - "./config/vector/vector.yaml:/etc/vector/vector.yaml"
This defines an accessory called vector that uses the docker image timberio/vector:latest-alpine. This will run on all hosts with the role web, which is useful if you need to horizontally scale your application. Mounting the /var/run/docker.sock volume allows Vector to monitor the logs of any containers running on the host (remember how the Rails app is configured to output to STDOUT?). Finally, we'll configure Vector with a vector.yaml file.
At the time of this writing, the files configuration seems to be an undocumented feature. When Kamal deploys your app, it'll make a copy of the vector.yaml file on each web host and mount it to the vector accessory.
Vector
Vector is an open source tool used for observability infrastructure. We can use Vector to monitor and observe our application logs and ship them to Honeybadger Insights for storage and processing.
Create a file located at config/vector/vector.yaml in your project directory, and start with the following:
sources:
  docker:
    type: "docker_logs"
Vector works on a series of pipelines: starting from a source, going through a series of transforms, and finally ending up in a sink. In this configuration, we are telling Vector that one of our sources is docker_logs. Vector will monitor the Docker socket for any logs outputted.
Add a transform for processing the docker source:
transforms:
  parse_logs:
    type: "remap"
    inputs: ["docker"]
    source: |
      payload, err = parse_json(string!(.message))
      if err == null {
        .payload = payload
        del(.message)
      }
As you may have heard, structured logging is good! That's why Vector has built-in functionality to handle this. This transform takes in the docker source and pipes it into a bit of code. If the log message can be parsed as a JSON object, it gets set to a payload key and the initial message gets removed. If the log message can't be parsed, the log message gets passed on.
Finish off the pipeline with a sink. Add the following to your vector.yaml:
sinks:
  honeybadger_events:
    type: "http"
    inputs: ["parse_logs"]
    uri: "https://api.honeybadger.io/v1/events"
    request:
      headers:
        X-API-Key: "<YOUR HONEYBADGER API KEY HERE>"
    encoding:
      codec: "json"
    framing:
      method: "newline_delimited"
Taking the parse_logs transform output, this sink tells Vector to send the logs to the Honeybadger events endpoint for processing. Be sure to set your Honeybadger API key first. This completes the Vector configuration.
Push up the vector configuration file:
kamal env push
Start (or restart) the vector container on each web host, mounting the volumes and files as needed:
kamal accessory reboot vector
Vector will start monitoring the docker daemon on your server and ship any logs to Insights. If you take a look at your Insights tab in Honeybadger, you should see logs coming through!
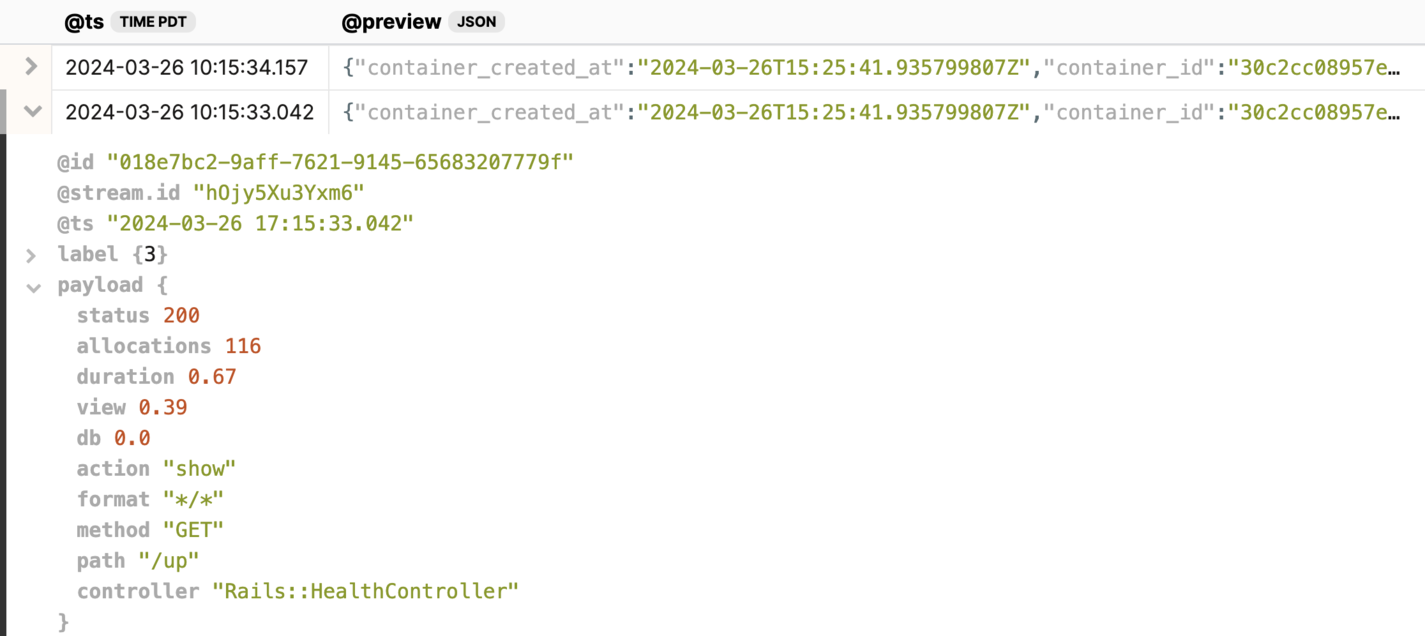 Rails application logs from Kamal in Honeybadger Insights
Dive into Insights
Honeybadger Insights is our new logging, observability, and event-tracking platform. By integrating your existing Honeybadger data—like errors and uptime monitoring—with your application logs, custom events, and metrics, Insights lets you get deeper into data analytics like never before. Here are a few things you can do:
- Query your Rails logs and filter based on the context attached via your structured logs.
- Cross-reference errors with logs and see the data in one place.
- Collect metrics and gain visibility into your application performance.
- Build custom dashboards to detect anomalies and see everything at a glance.
Best of all, Insights is available on our free Developer plan, so you can start sending your events right away!
Logs are just one of the things Insights is great for. Insights helps you go beyond just basic observability and monitoring. Take a look at Josh's article on Visualizing Ahoy analytics in Rails for another practical example of what you can do with Insights.


 Molly Struve, Sr. Site Reliability Engineer, Netflix
