The Honeybadger Changelog

Here's what's cooking at Honeybadger.

Elixir performance monitoring for Phoenix, Oban, and more

Introducing Elixir performance monitoring in Honeybadger!

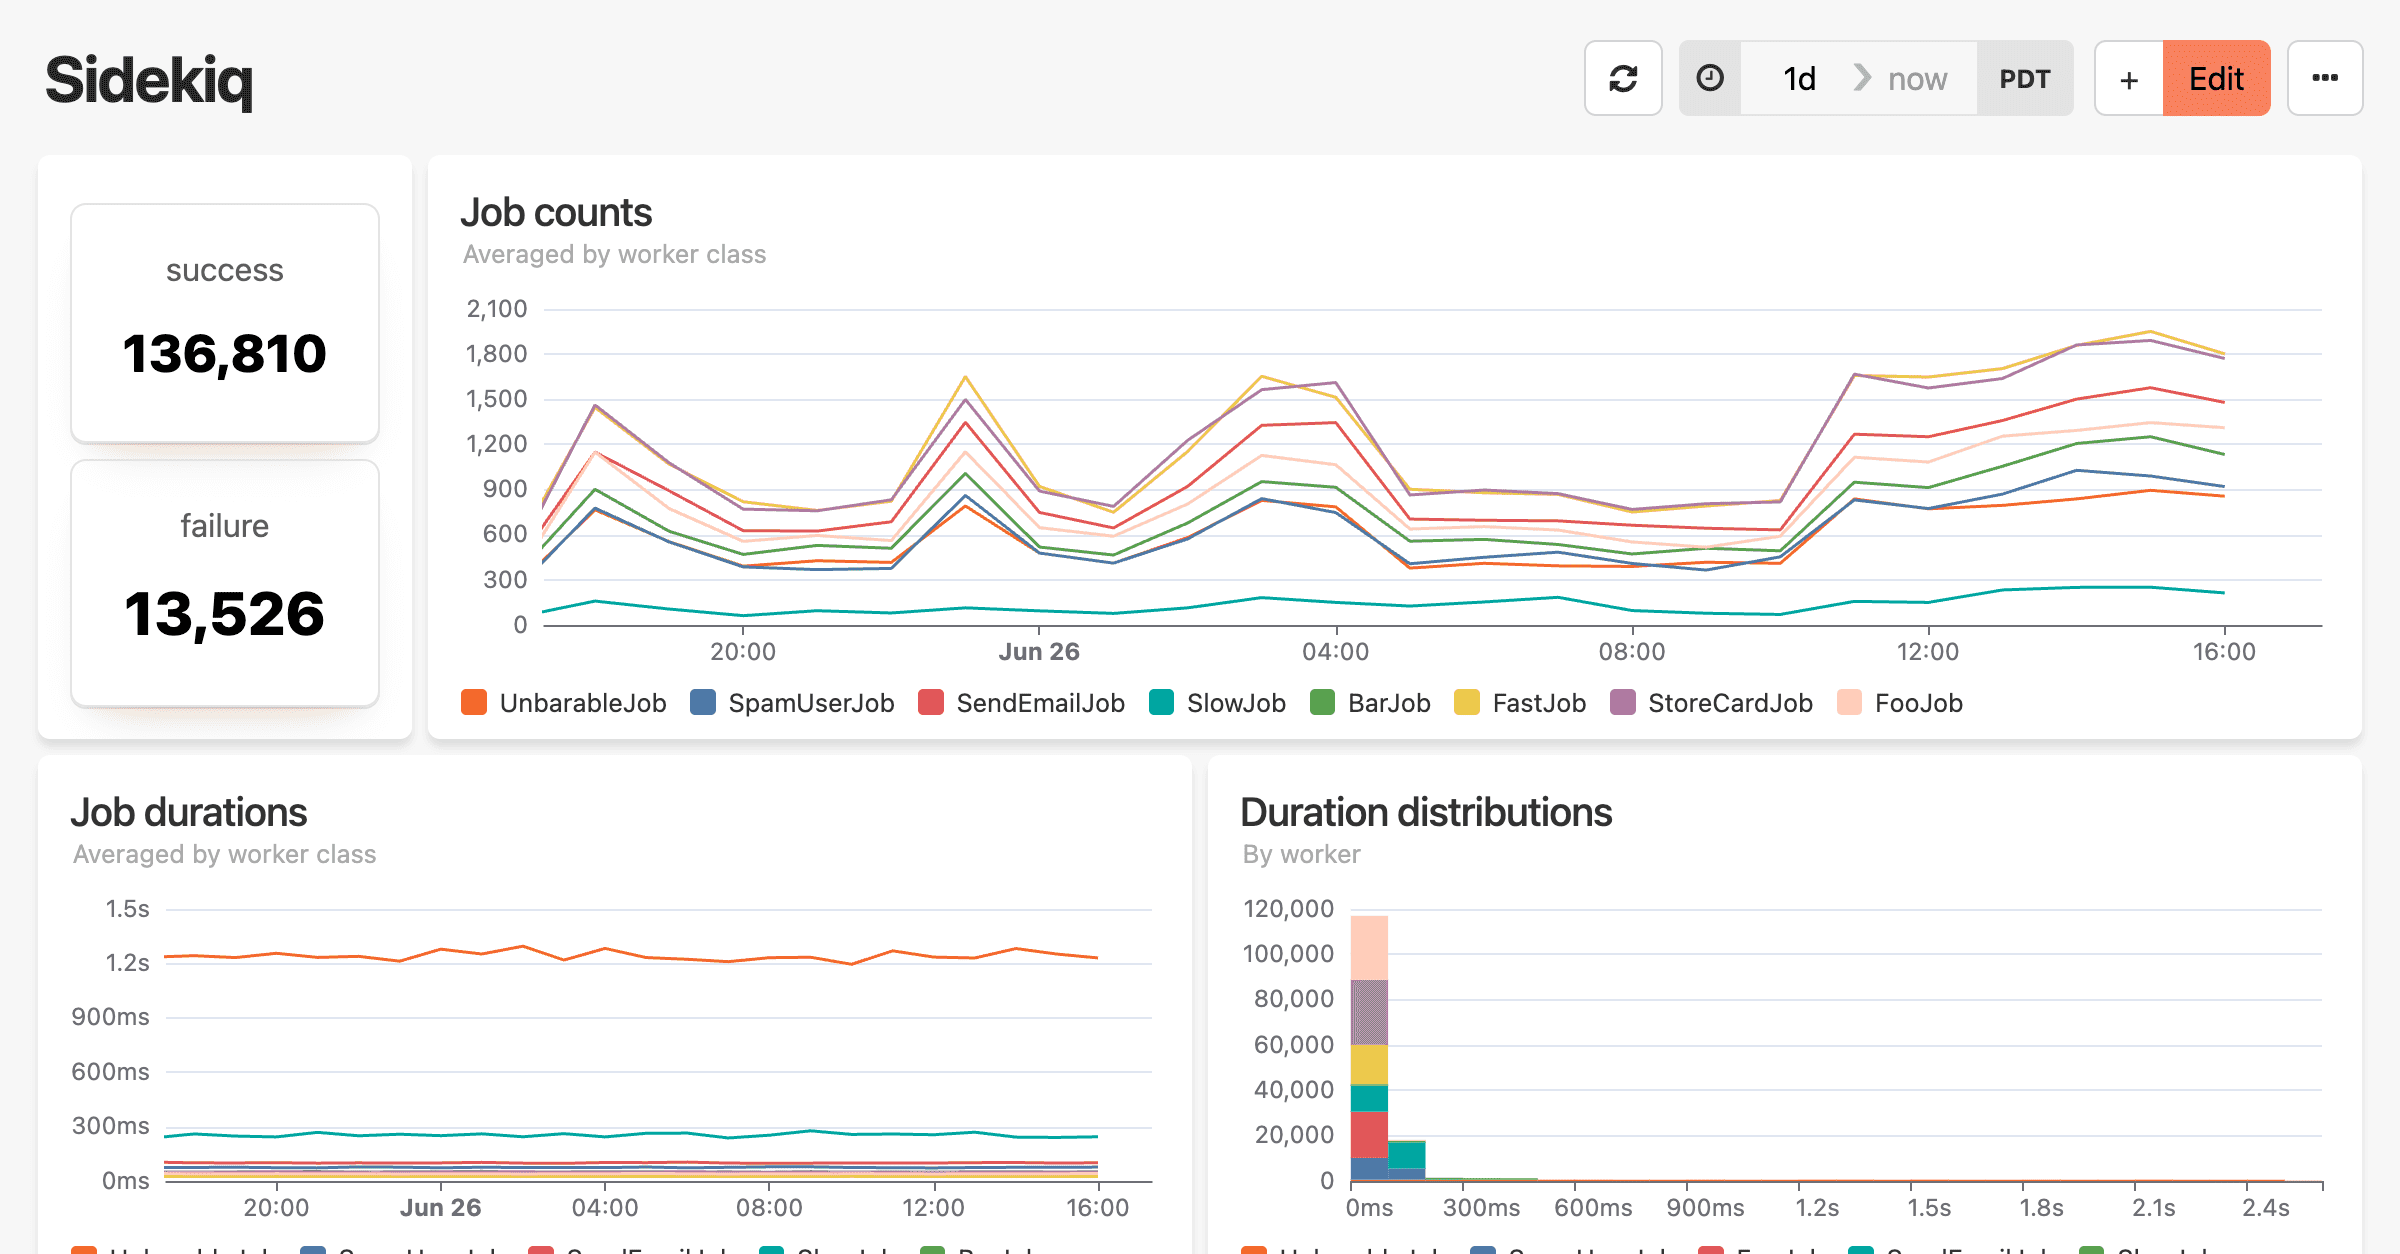
A composite view of Oban, Phoenix, and Elixir application performance monitoring dashboards showing multiple monitoring interfaces layered together. The top portion displays a line graph tracking several metrics over time on March 28, with blue and red lines showing activity patterns throughout the day. Below are two performance analysis tables titled "10 Slowest Controller Actions" and "10 Slowest Ecto Queries" containing database query performance data. In the foreground are two overlapping dashboard cards: on the left, a "Phoenix" monitoring panel showing 9,913 requests with accompanying line graphs, and on the right, the "Oban" background job monitoring panel displaying 82,426 successful jobs and additional status counts (839 discarded, 798 snoozed, 8,273 failures). Both panels include time controls for "1d" and "3d" views in PDT timezone with edit buttons, presenting a comprehensive view of web application and background job performance metrics.

We've added three new features to Honeybadger Insights:

  1. A new Phoenix performance dashboard. Instead of creating a dashboard from scratch, select " Phoenix" from our list of curated monitoring dashboards. The new dashboard allows you to monitor requests, slow controllers, Ecto queries, and more.
  2. A new Oban dashboard. We love Oban at Honeybadger and thought it would be the perfect companion to the Phoenix dashboard (the first of many useful dashboards, we hope!). The Oban dashboard gives you a quick overview of your Oban performance, including job counts by status, worker stats, and slow jobs.
  3. Elixir & Phoenix performance instrumentation. Our Hex package now automatically sends performance events and metrics (via telemetry) from Phoenix and other popular libraries. The new instrumentation powers your dashboard, but you can also use our query language (BadgerQL) to dig into the data yourself, which creates some exciting possibilities.

To use these features, you'll need to upgrade to version ~> 0.24 of the the honeybadger Hex package and enable a config option in your config.exs:

config :honeybadger,
  insights_enabled: true

Honeybadger automatically instruments the following libraries when they are available:

  • Ecto: Database queries
  • Plug/Phoenix: HTTP requests
  • LiveView: Phoenix LiveView lifecycle events
  • Oban: Background job processing
  • Absinthe: GraphQL query execution
  • Finch: HTTP client requests, often used by other libraries like Req
  • Tesla: HTTP client requests

You can also customize the default dashboards and send custom logs and events to Honeybadger — read the full blog post to learn more.

Insights Alarms

Alarms bridge the gap between data and action, transforming any query into an actionable alert that notifies your team. Honeybadger Insights gives you granular control over monitoring without deploying new instrumentation—write a query, set a threshold, and stay ahead of issues before they impact users.

A monitoring dashboard titled "Slow requests" showing system performance over time. The status shows "ok" with "Checked 5 min ago - Next in < 1 min". The time range displays "1h" to "now" in PST timezone. The line graph shows no slow requests from 08:20 to 08:55, then a sharp increase at 09:00 to 1, peaking at 09:05 with a value of 3 (marked by a red dashed threshold line), then decreasing to 2 by 09:10. The timeline at the bottom shows mostly green status with a red segment around 09:05, indicating a brief period of performance issues.

You can send alerts to Slack, PagerDuty, or any of Honeybadger’s many 3rd-party integrations—giving you incredible flexibility when notifying your team and choosing when and how to respond.

To get started, head over to the new Alarms tab in your Honeybadger project to create your first alarm:

A monitoring dashboard showing the "Alarms" section of an application performance monitoring tool. The navigation menu at the top displays multiple monitoring options: Errors, Insights, Dashboards, Alarms (currently selected), Uptime, Check-Ins, Deployments, Reports, and more options. The main content area shows an "Alarms" heading with a "+ Create Alarm" button in the top right corner. Listed below is one active alarm called "Slow requests" with a green status indicator, showing it was "Last checked 42 min ago, next check 37 min."

Read our announcement blog post and check out the developer docs to learn more.

Insights Alarms are available on the Business plan.

Find events with request ID

We added a new "find events with request ID" option to the Insights data context menu for request_id fields. This is especially useful when exploring your application events and you find a request that you want to check out.

A log monitoring interface showing detailed request information with timestamp and JSON preview columns. The expanded view displays HTTP status 200 and a request ID, with a context menu opened over the request ID field. The menu is labeled "Request ID" with multiple options including "find events with request ID" (highlighted with an orange arrow), "add request_id to fields," "count by request_id," "request_id == ?", "parse request_id/?/", an exact match query option for the specific request ID, and "copy to clipboard." Below the expanded section are multiple log entries with timestamps from March 2025, showing various event types including statistics for a server application with their corresponding durations and hostnames.

Clicking the option replaces the current Insights query with the BadgerQL for finding a set of correlated events for that request:

fields @ts, @preview
| filter request_id::str == "$value"
| sort @ts

EU data residency

If your company has EU data residency requirements, you can now use all of Honeybadger's powerful application performance monitoring tools with the peace of mind that your customer data resides in the European Union.

We've launched a new dedicated EU Honeybadger region that allows customers to store their application performance monitoring and error tracking data entirely within the EU. This service operates from AWS's eu-central-1 region in Frankfurt, Germany, and is available at eu-app.honeybadger.io.

Accounts within Honeybadger's new EU region are purchased separately, allowing you to choose different tiers depending on your usage between our U.S. and EU regions.

Existing customers can create a new EU account without changing their current U.S. account, and new customers can choose their preferred region during signup.

All Honeybadger accounts come with our standard 30-day free trial, and the pricing is the same across both regions. To get started, sign up for a new Honeybadger EU account.

Explore error tracking data in Honeybadger Insights

One of the best ways to get started with Honeybadger Insights is to use it with your existing Honeybadger error tracking data—which we include for free with every error tracking plan.

Sometimes you want to know something about a particular error, how many errors have occurred with a specific bit of context data, what else was happening around the time the error occurred, etc.

To make it easier to answer these questions quickly, we’ve added Insights context menus to the error detail page. When you hover over any Insights-enabled field, you’ll notice that the value is highlighted. Click to open a context menu with common Insights operations for that field.

The menu options change based on the type of data (for example, if it’s a number, you’ll see a count operation). When you select an option it opens the query in Insights, making it easy to explore from there.

View an error in Honeybadger to try it out.

Performance monitoring for Laravel

Introducing Laravel performance monitoring in Honeybadger!

Laravel/Statamic Performance dashboard in Honeybadger, showing various charts and metrics over a 7-day period. Charts include request counts, response distributions, job durations, response codes, and tables for slowest controllers and requests.

We've added two new features just for Laravel developers:

  1. A new Laravel performance dashboard. Instead of creating a dashboard from scratch, select “ Laravel” from our list of curated monitoring dashboards. The new dashboard allows you to monitor requests and background jobs, slow requests and queries, and more.
  2. Laravel performance instrumentation. Our composer package now automatically sends performance events and metrics from Laravel. The new instrumentation is what powers your dashboard, but you can also use BadgerQL to dig into the data yourself.

To use these features, you'll need to upgrade to version 4.2.x of the honeybadger-laravel composer package and enable a config option in config/honeybadger.php:

  'events' => [
      'enabled' => true
  ]

You can also customize the default dashboard and send your application logs to Honeybadger — read the full blog post to learn more.

Use streams to improve query performance in Honeybadger Insights

Streams are the fundamental data sources in Honeybadger Insights. They serve as the starting point for your queries and represent the data you want to analyze.

When you create a new Honeybadger project, we automatically set up two streams: an Internal stream for your Honeybadger-generated events (like errors, uptime checks, and notifications), and a Default stream for the custom data you send to Honeybadger.

You can select the active streams from the steam selector at the top of the query editor. This affects the data that Insights returns for your queries.

A search interface in a logging system with two tabs highlighted in a red outline: "Default" and "Internal," both with close (X) buttons. Below the tabs is a query that selects timestamp and preview fields, sorting by timestamp. The search controls show a 3-hour time range in PDT timezone, with results showing "1000 of 1.00K results" and a green checkmark indicating successful execution.

Removing a stream you don't need can improve your query response times because Insights doesn't need to scan that data when executing your query. So, for example, if you're querying your application telemetry, you can remove the Internal stream to get a faster response.

You can’t create additional streams yet, but that’s something we’re considering.

Check out the developer docs to learn more.

This changelog began on October 1, 2024. This is the end!