Predicting the Future With Linear Regression in Ruby
Many choices that we make revolve around numerical relationships.
- We eat certain foods because science says they lower our cholesterol
- We further our education because we're likely to have an increased salary
- We buy a house in the neighborhood we believe is going to appreciate in value the most
How do we come to these conclusions? Most likely, someone gathered a large amount of data and used it to form conclusions. One common technique is linear regression, which is a form of supervised learning. For more info on supervised learning and examples of what it is often used for, check out Part 1 of this series.
Linear Relationships
When two values — call them x and y — have a linear relationship, it means that changing x by 1 will always cause y to change by a fixed amount. It's easier to give examples:
- 10 pizzas cost 10x the price of one pizza.
- A 10-foot-tall wall needs twice as much paint as a 5-foot wall
Mathematically, this kind of relationship is described using the equation of a line:
y = mx + b
Math can be dreadfully confusing, but oftentimes it seems like magic to me. When I first learned the equation of a line, I remember thinking how beautiful it was to be able to calculate distance, slope, and other points on a line with just one formula.
But how do you get this formula, if all you have are data points? The answer is linear regression — a very popular machine learning tool.
An Example of Linear Regression
In this post, we are going to explore whether the beats per minute (BPM) in a song predicts its popularity on Spotify.
Linear regression models the relationship between two variables. One is called the "explanatory variable" and the other is called the "dependent variable."
In our example, we want to see if BPM can "explain" popularity. So BPM will be our explanatory variable. That makes popularity the dependent variable.
The model will utilize least-squares regression to find the best fitting line of the form, you guessed it, y = mx + b.
While there can be multiple explanatory variables, for this example we'll be conducting simple linear regression where there is just one.
Least-Squares What?
There are several ways to do linear regression. One of them is called "least-squares." It calculates the best fitting line by minimizing the sum of the squares of the vertical deviations from each data point to the line.
I know that sounds confusing, but it's basically just saying, "Build me a line that minimizes the amount of space between said line and the data points."
The reason for the squaring and summing is so there aren't any cancellations between positive and negative values.
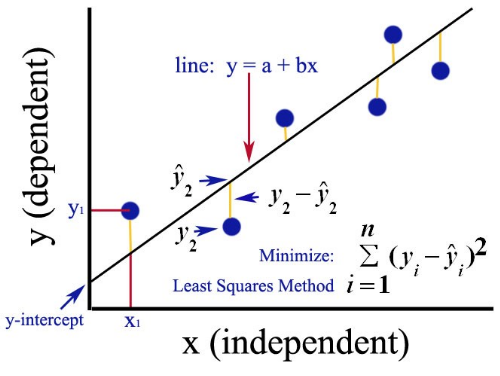
Here is an image I found on Quora that does a pretty good job of explaining it.
The Dataset
we will be using this dataset from Kaggle: https://www.kaggle.com/leonardopena/top50spotify2019 You can download it as a CSV.
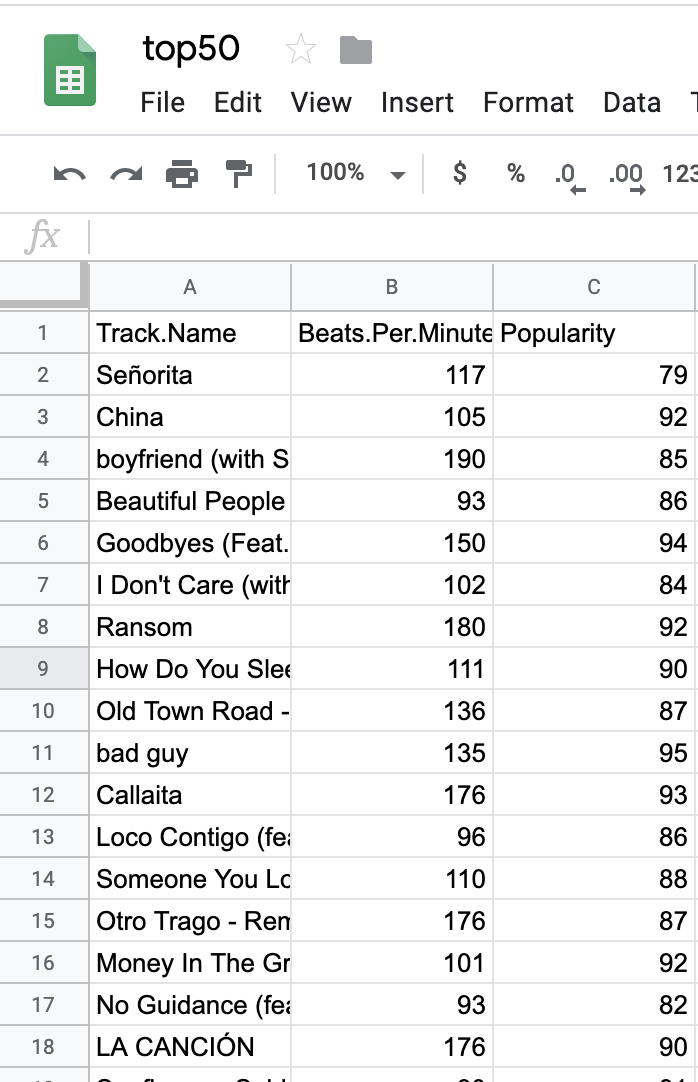
The dataset has 16 columns; however, we only care about three — "Track Name," "Beats Per Minute," and "Popularity." One of the most important steps of machine learning is getting your data properly formatted, often referred to as "munging." You can delete all of the data except for the three aforementioned columns.
Your CSV should look like this:
Using Ruby to do the Regression
In this example, we will be utilizing the ruby_linear_regression gem. To install, run:
gem install ruby_linear_regression
OK, we're ready to start coding! Create a new Ruby file and add these requires:
require "ruby_linear_regression"
require "csv"
Next, we read our CSV data and call #shift, to discard the header row. Alternatively, you could just delete the first row from the CSV file.
csv = CSV.read("top50.csv")
csv.shift
Let's create two empty arrays to hold our x-data points and y-data points.
x_data = []
y_data = []
...and we iterate using the .each method to add the Beats Per Minute data to our x array and Popularity data to our y array.
If you're curious to see what is actually happening here, you can experiment by logging your
rowwith either aputsorp. For example:puts row
csv.each do |row|
  x_data.push( [row[1].to_i] )
  y_data.push( row[2].to_i )
end
Now it's time to use the ruby_linear_regression gem. We'll create a new instance of our regression model, load our data, and train our model:
linear_regression = RubyLinearRegression.new
linear_regression.load_training_data(x_data, y_data)
linear_regression.train_normal_equation
Next, we'll print the mean square error (MSE) — a measure of the difference between the observed values and the predicted values. The difference is squared so that negative and positive values do not cancel each other out. We want to minimize the MSE because we do not want the distance between our predicted and actual values to be large.
puts "Trained model with the following cost fit #{linear_regression.compute_cost}"
Finally, let's have the computer use our model to make a prediction. Specifically, how popular will a song with 250 BPM be? Feel free to play around with different values in the prediction_data array.
prediction_data = [250]
predicted_popularity = linear_regression.predict(prediction_data)
puts "Predicted popularity: #{predicted_popularity.round}"
Results
Let's run the program in our console and see what we get!
➜  ~ ruby spotify_regression.rb
Trained model with the following cost fit 9.504882197447587
Predicted popularity: 91
Cool! Let's change the "250" to "50" and see what our model predicts.
➜  ~ ruby spotify_regression.rb
Trained model with the following cost fit 9.504882197447587
Predicted popularity: 86
It appears that songs with more beats per minute are more popular.
Entire Program
Here's what my entire file looks like:
require 'csv'
require 'ruby_linear_regression'

x_data = []
y_data = []
csv = CSV.read("top50.csv")
csv.shift

# Load data from CSV file into two arrays -- one for independent variables X (x_data) and one for the dependent variable y (y_data)
# Row[0] = title
# Row[1] = BPM
# Row[2] = Popularity
csv.each do |row|
  x_data.push( [row[1].to_i] )
  y_data.push( row[2].to_i )
end

# Create regression model
linear_regression = RubyLinearRegression.new

# Load training data
linear_regression.load_training_data(x_data, y_data)

# Train the model using the normal equation
linear_regression.train_normal_equation

# Output the cost
puts "Trained model with the following cost fit #{linear_regression.compute_cost}"

# Predict the popularity of a song with 250 BPM
prediction_data = [250]
predicted_popularity = linear_regression.predict(prediction_data)
puts "Predicted popularity: #{predicted_popularity.round}"
Next Steps
This is a very simple example, but nevertheless, you've just run your first linear regression, which is a key technique used for machine learning. If you're yearning for more, here are a few other things you could do next:
- Check out the source code for the Ruby gem we were using to see the math happening under the hood
- Go back to the original data set and try adding additional variables to the model and run a multi-variable linear regression to see if that can reduce our MSE. For example, maybe "valence" (how positive the song is) also plays a role in popularity.
- Try out a gradient descent model, which can also be run using the
ruby_linear_regressiongem.

Written by
Julie KentJulie is an engineer at Stitch Fix. In her free time, she likes reading, cooking, and walking her dog.