Have you ever dealt with an error in production, and no matter what you try, you can't replicate the issue on your development or staging environments? Often the next step is to gather more data by tossing a debug log at production. If you don't have a good way to correlate logs with a request it can be frustrating, especially during an incident.
We added a feature to help, and it's called Breadcrumbs.
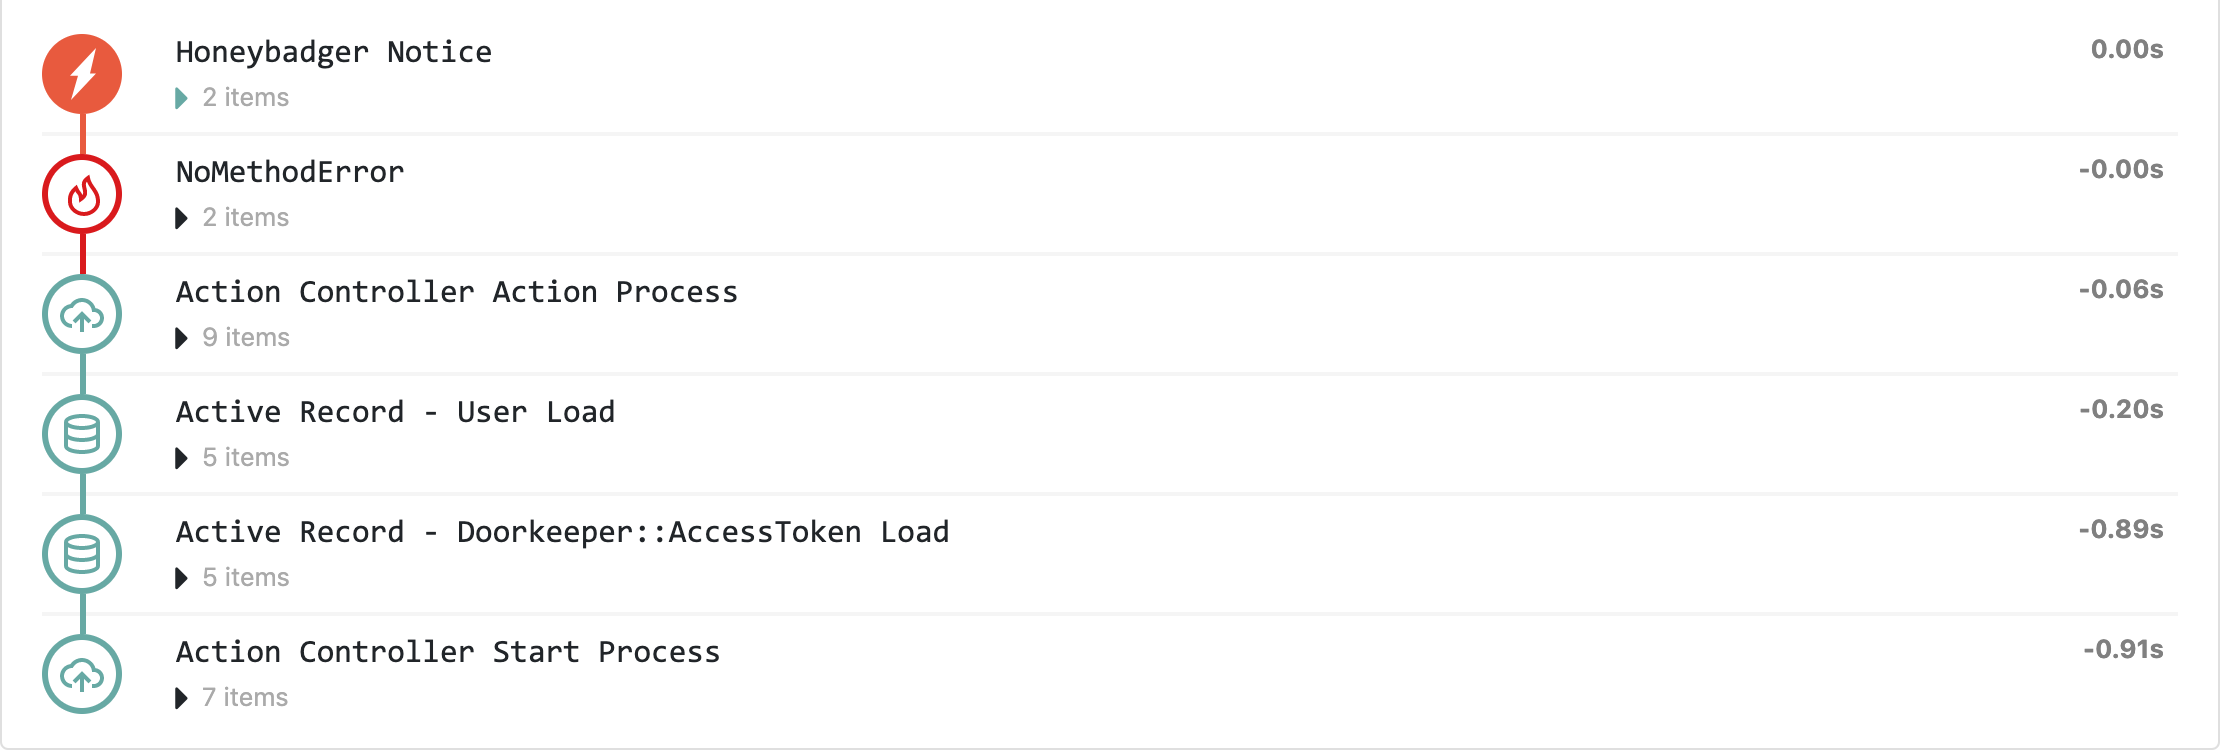
A Breadcrumb is very much like a log event, but it's stored and reported along side an error. Like a log, a Breadcrumb contains a message, but it can also hold metadata (in the form of a hashmap). A set of breadcrumbs are collected throughout the life of a request (or job invocation), and are immediately dropped unless an error is reported.
Adding your own breadcrumbs to the stack is simple. Just make a call to Honeybadger.add_breadcrumb anywhere in your code:
Honeybadger.add_breadcrumb("Loading User", metadata: {
  user_name: user_name,
})
And if an error is reported after it, you should see it in the Breadcrumb stack:

Oh user_name looks empty, that might cause problems.
Automatic breadcrumbs
The Honeybadger Ruby library contains hooks into Ruby & Rails to automatically collect breadcrumbs. For example, all log messages emitted in Production (sent through the Logger class) are captured and created as breadcrumbs. We also tie into Rails Instrumentation to gather breadcrumbs for Controller Actions, SQL Queries, Active Job invocations, etc...
How can you use it?
Breadcrumbs are currently available via our Ruby client. You must update to version 4.4.0 and be sure to enable it in the config as it will be disabled by default until we release a 5.0.0 version of the gem, to ensure we work out any kinks.
Please try it out and let us know if you run into any issues.
Extending Breadcrumbs
Now that Breadcrumbs have been formally introduced, let's see a quick example of how to extend them. If you enable Breadcrumbs in a Rails app, you will get some standard instrumentation breadcrumbs attached for free, but what if we want more?
Let's say we want to create a Breadcrumb every time our app sends out an HTTP request. This info might come in handy while debugging.
A simple way to accomplish this would be to call Honeybadger.add_breadcrumb at each request invocation.
def send_a_message
  res = conn.post("/message", { user: user.id, body: "Hey!" }.to_json)
  Honeybadger.add_breadcrumb("Request: /message", metadata: { user: user.id })
  res
end
Here we store a breadcrumb after every POST to /message. The next time our app throws an error after sending this message, we should see which user sent the message and when it happened in relation to the error, Yay!
This is a bit cumbersome though, as we would need an add_breadcrumb call at each location we send out a request. I do want to note, however, there are advantages to creating breadcrumbs like this. You can be very specific about what metadata you want to capture with this method. Often this is a great way to gather targeted information motivated by a bug in production.
Really I just want to know when and where a request goes out. It would also be nice if a library could do most of the work for me ;).
Instrumenting with Faraday
We are going to cheat a little and assume you are using the popular Faraday request library.
We could build our own middleware to accomplish our task, but instead I want to use Rails instrumentation as a broker. Luckily, there is middleware provided by the faraday_middleware gem that will emit events for us. Ensure the gem is in your Gemfile and also make sure the instrumentation middleware is injected into the connection.
connection = Faraday.new do |conn|
  conn.use :instrumentation
  conn.adapter Faraday.default_adapter
end
This can require a little work if you don't share your connection inside your app. If you are lazy you can also prepend the ConnectionOptions to ensure that all requests have the middleware enabled. Be careful though, as this will instrument any Faraday requests that happen within your app and included gems as well (which you might want)!
Using Rails instrumentation has some nice side effects, one being that we can make multiple subscriptions for other use cases (say for general logging purposes).
Binge watching our requests
Now that our Faraday requests are instrumented, we can subscribe and get to creating some breadcrumbs:
ActiveSupport::Notifications.subscribe "request.faraday" do |_, _, _, _, data|
  method = data[:method].to_s.upcase
  metadata = data.to_h.slice(:url, :status).merge({method: method})
  Honeybadger.add_breadcrumb("#{method}: #{metadata[:url]}", category: "request", metadata: metadata)
end
Honeybadger is now adding a breadcrumb for each outgoing request!
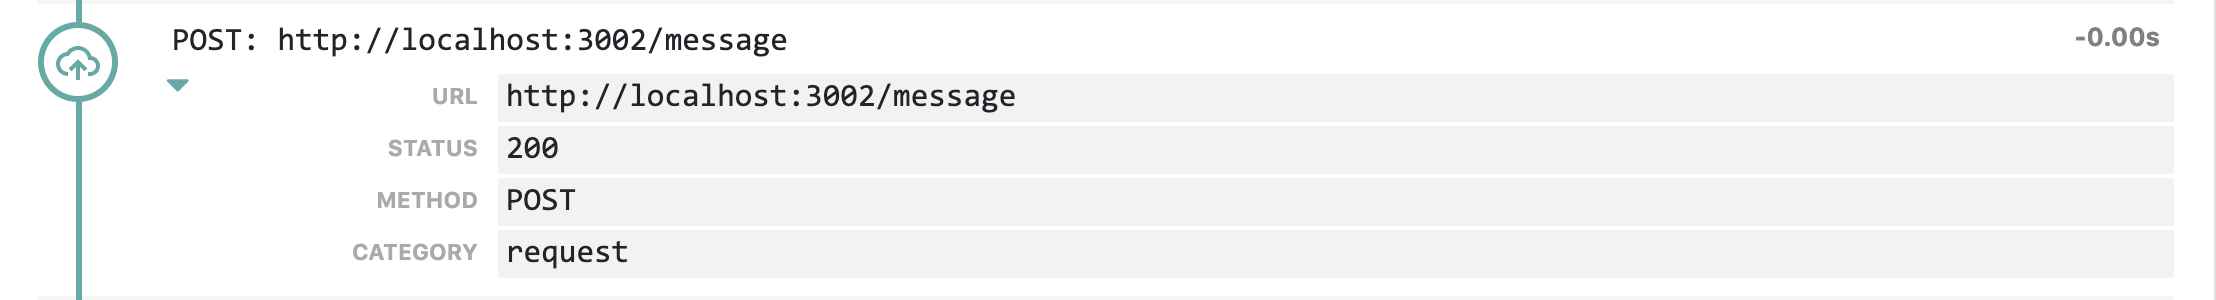
Notice we are only inspecting a few data points from our requests. We don't add outgoing or response body payloads as there is a good chance that sensitive data could leak into our breadcrumb metadata.
Let us know how it goes!
We hope that Breadcrumbs will be a helpful addition your debugging toolbox. Try it out, and give us a shout if there is anything you would like to see added.


