Error Tracking and Application Performance Monitoring
All-in-one app monitoring for large engineering teams
Built for engineering teams running production at scale. Everything your team needs in one shared platform — without enterprise complexity or cost.
No credit card required
Helping devs at companies like:












Built for engineering teams running at scale
Engineering orgs at this size need shared visibility across teams and on-call rotations. Honeybadger gives everyone the context to find and fix problems fast — without another platform for someone to own full-time.
More signal, less noise
One view, not five dashboards
No per-host billing

"Honeybadger is built for engineers by engineers. That's their edge over Sentry or Datadog—they go straight to the end user, not C-suite sales. Error monitoring is a commodity, but their focus isn't."
ClickFunnels runs a 25-person engineering team on Honeybadger
ClickFunnels, a SaaS platform powering $10 billion+ in transactions, moved its error monitoring for every Rails and JavaScript app to Honeybadger.
33%
Expense savings
15+
Deploys per day
15
Projects migrated
Work together to ship faster
The engineer on call is rarely the one who wrote the code. Honeybadger keeps investigation, discussion, and issue tracking attached to the error itself so your team knows what broke, who's handling it, and what happened last time.
Team collaboration
Unlimited teams
Alert routing and escalation
Tool integrations
Already running Datadog? Honeybadger plays nice
Datadog is a strong enterprise APM platform, but error tracking is often an afterthought inside it. Honeybadger's native integration sends your error events straight into Datadog's monitoring stream, so your team gets purpose-built error tracking without ripping out the APM tooling you already depend on.
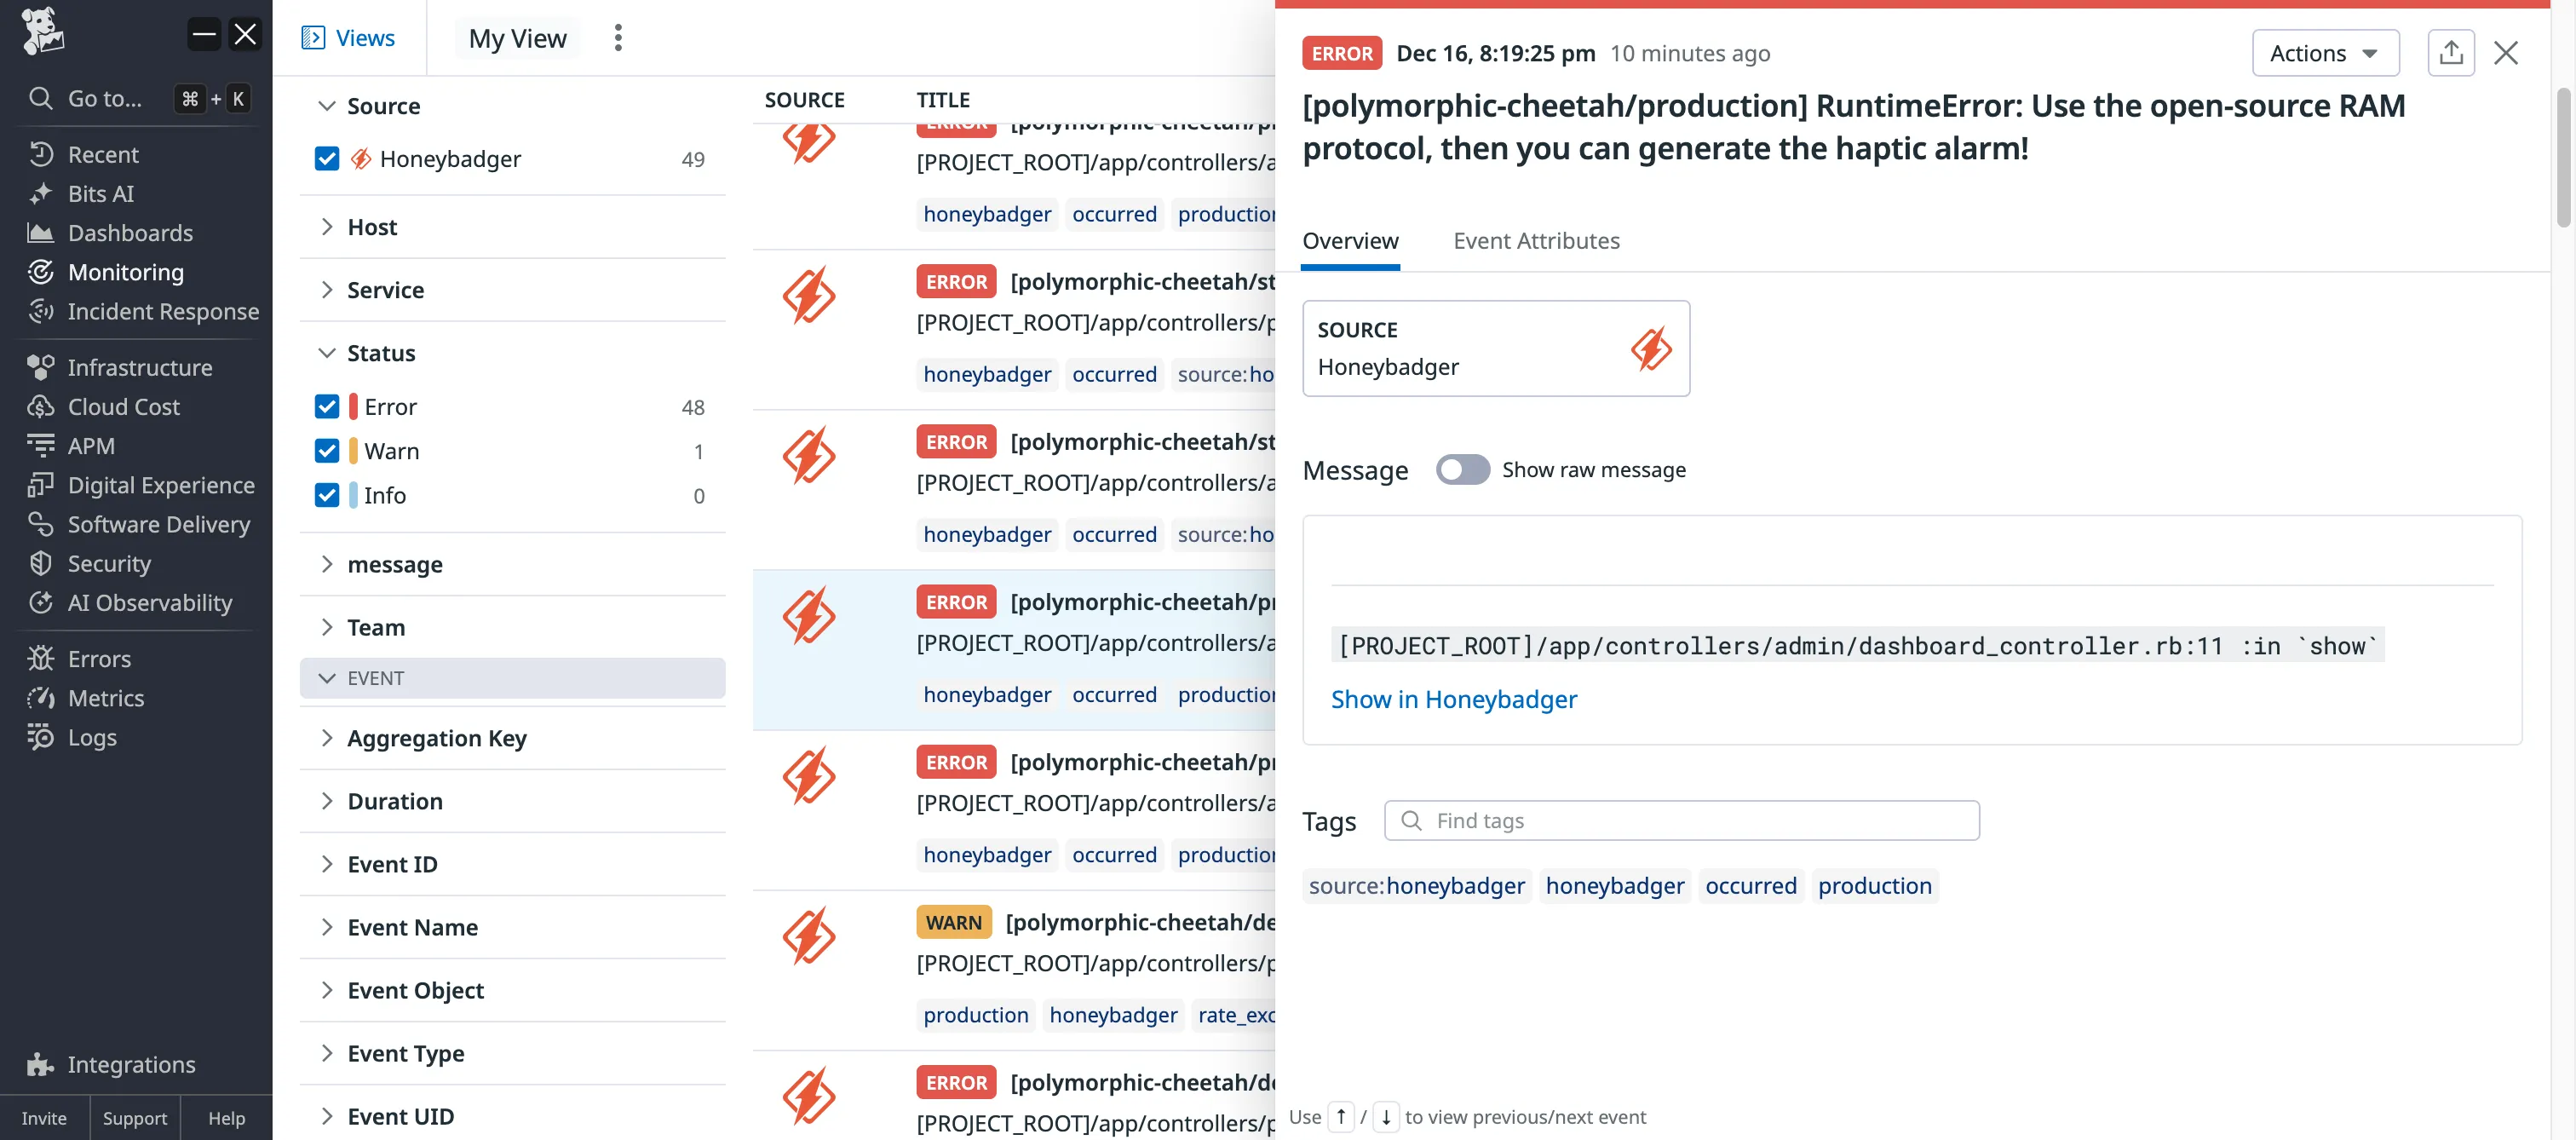
Honeybadger sends alerts to Datadog's cloud monitoring event stream
Security and compliance, without the enterprise price tag
SOC2, HIPAA, and EU data residency come with every plan. SSO, a BAA, and audit controls come with the Business plan, starting at $80/month.
SOC2
HIPAA Security
EU Data Residency
SAML, SSO, and custom sign-in
BAA
Audit controls
Six dazzling features for large engineering teams
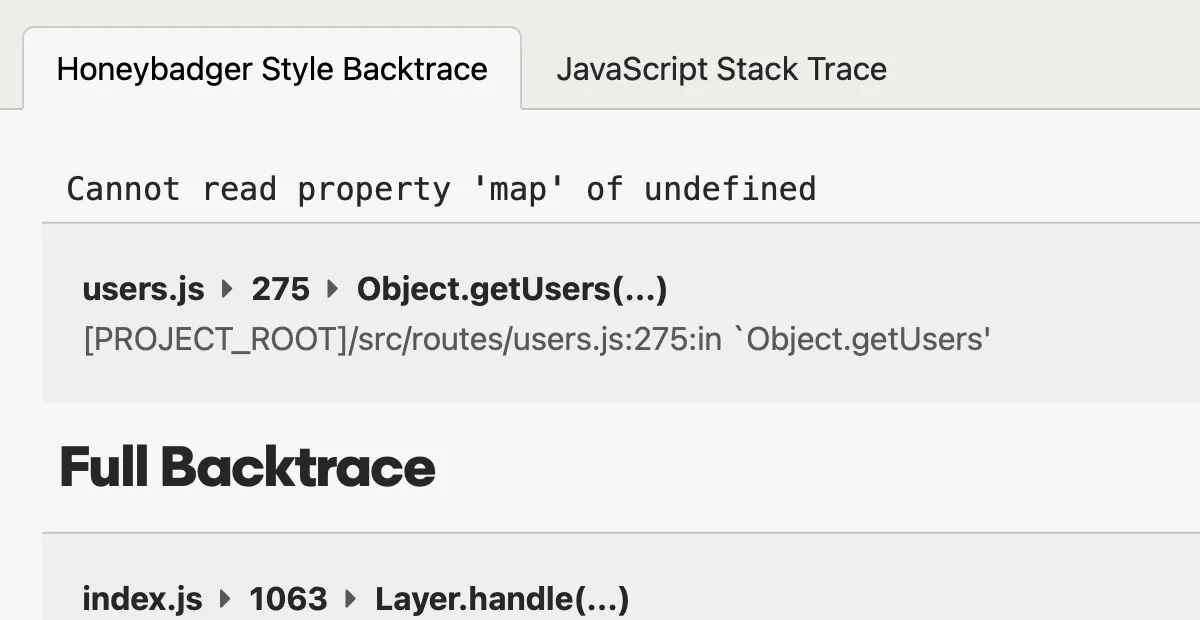
Error Tracking
Fix errors before customers complain
- Instant alerts with rich error context
- Smart grouping reduces noise
- Advanced search and query tools
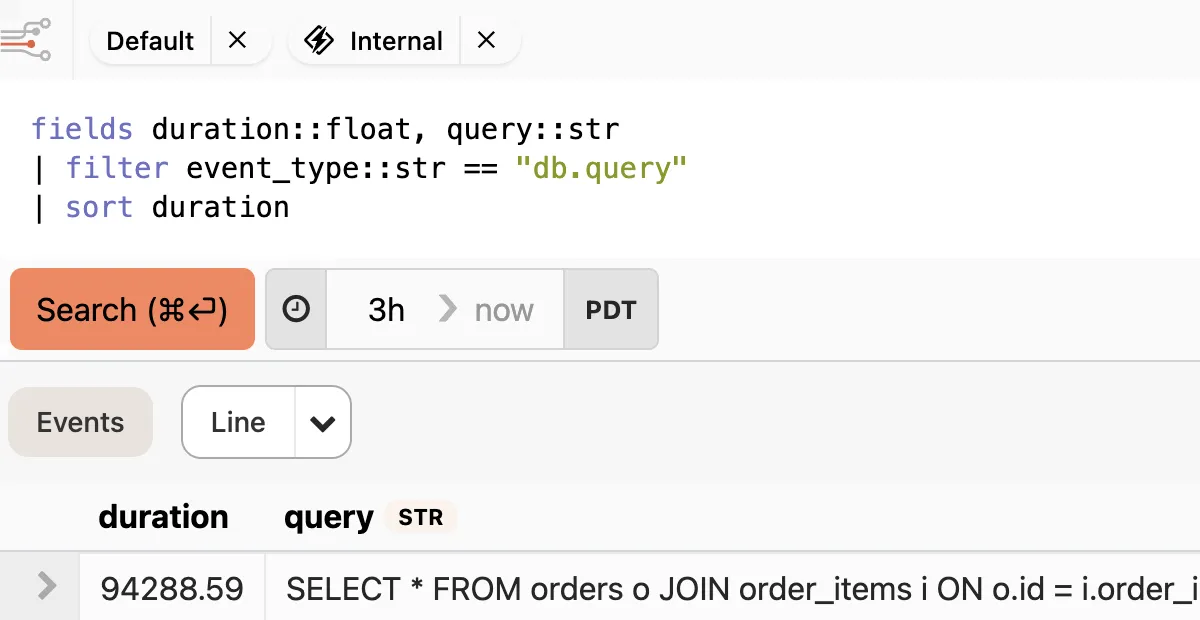
Logging & Observability
Debug production issues in minutes, not hours
- Structured logs that you can query and analyze
- Trace events across requests, jobs, and services
- Instant alerts from any pattern or event
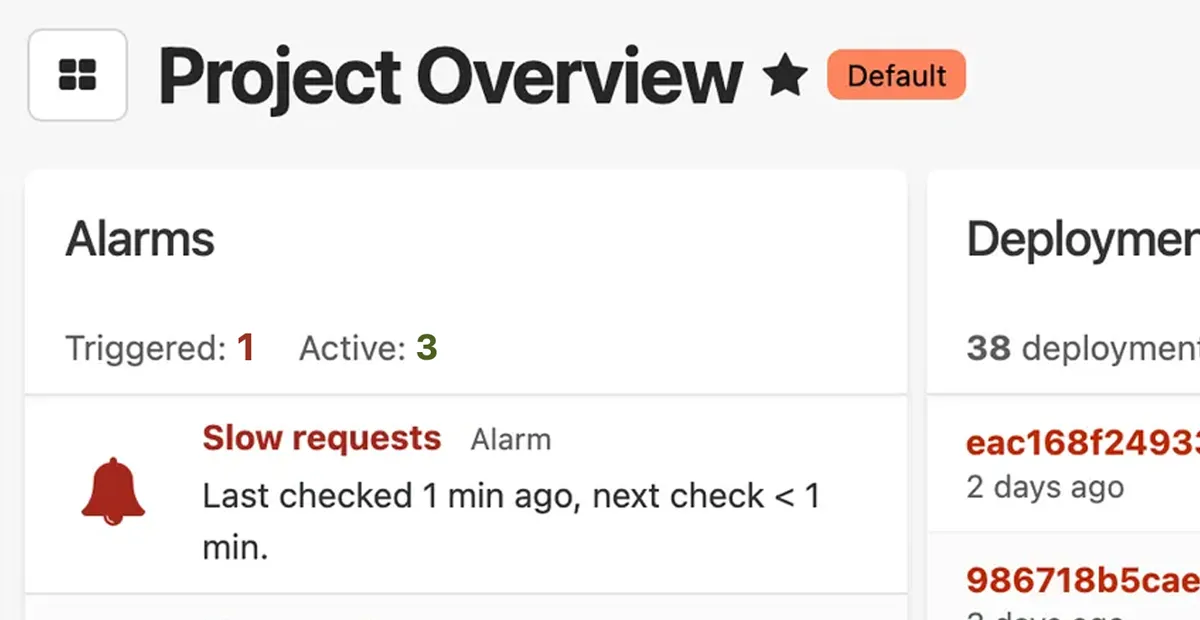
Application Performance Monitoring
Keep tabs on your apps and infrastructure
- Automatic dashboards for your stack
- Monitor web, worker, and query performance
- Create custom metrics without writing code
Uptime Monitoring
Know when your app is down before your customers do
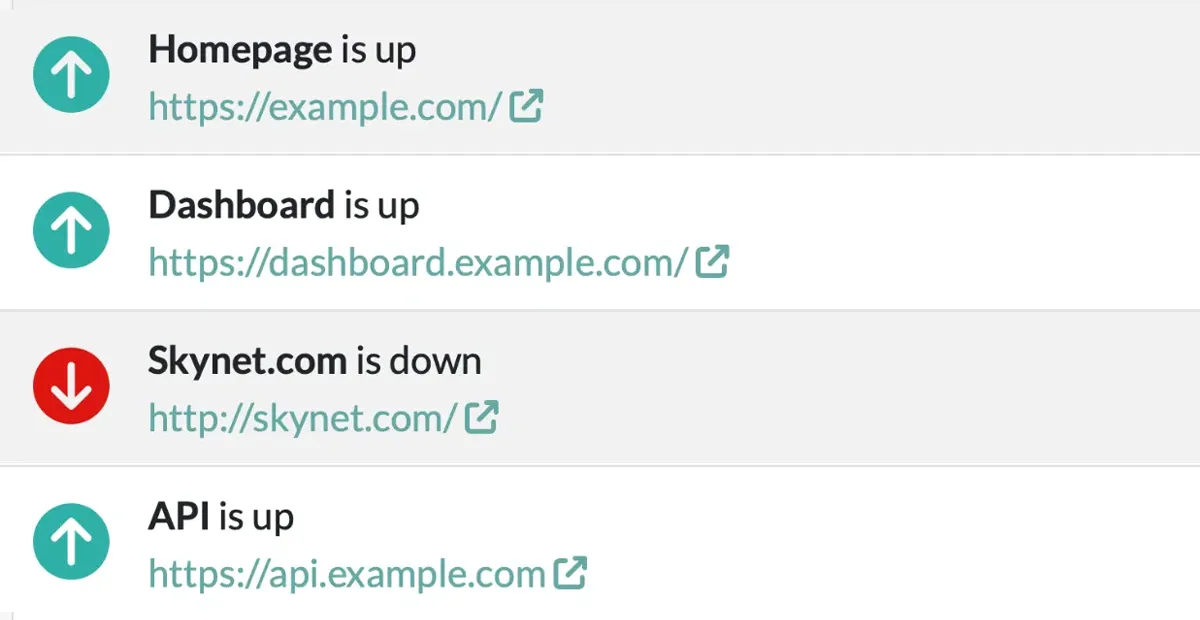
- Instant alerts when your site goes down
- Know exactly what's broken—not just that it's down
- Wake the right person with smart escalation rules
Cron Monitoring & Heartbeats (Check-ins)
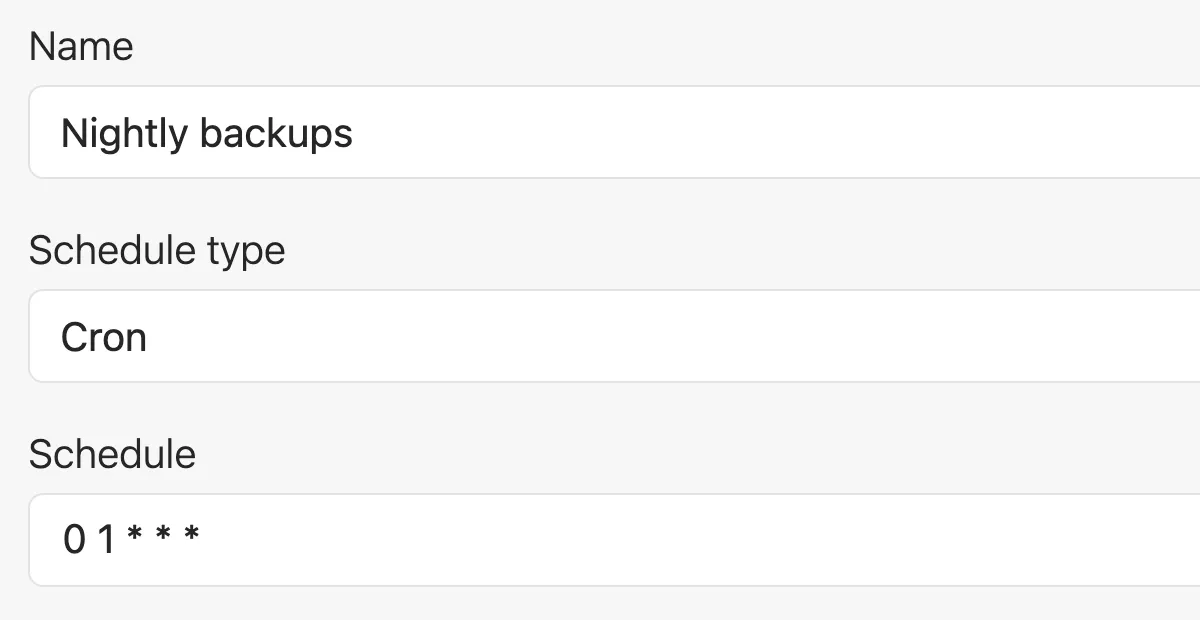
Make sure your background jobs and scheduled tasks run on time
- Alerts you when jobs fail or don't run at all
- Tracks success rates and execution over time
- Simple heartbeat API works with any stack
Status Pages
Keep your customers informed during an outage
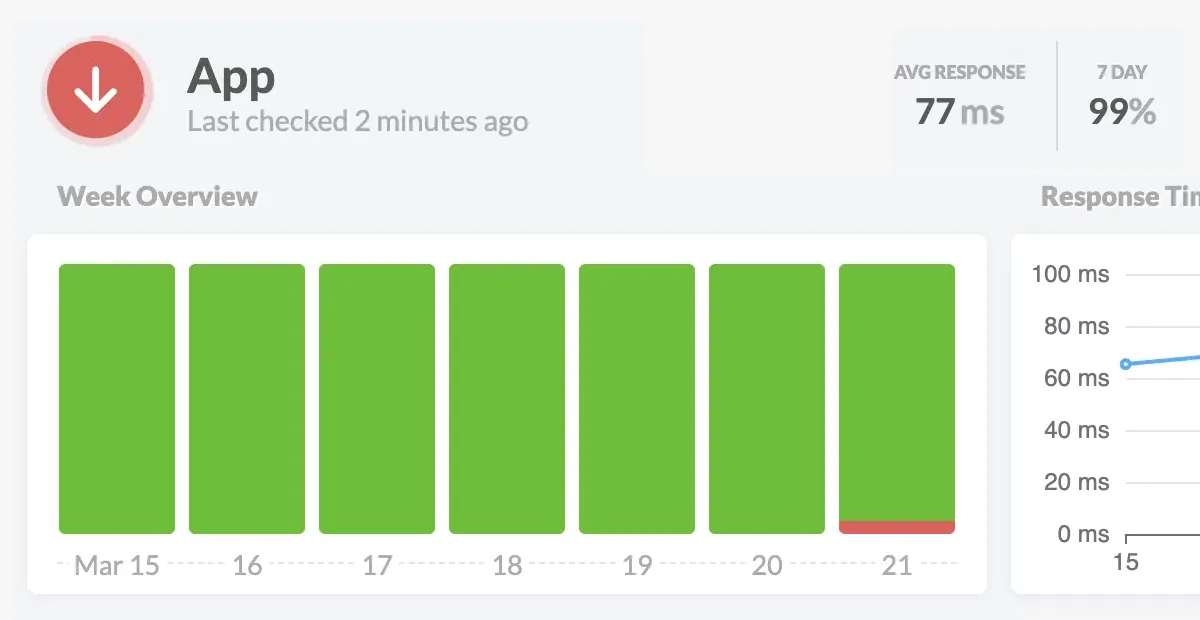
- Automatically updates when issues are detected
- Reduces support tickets during incidents
- Professional status page with your domain and branding
Start monitoring today, not next sprint
Setup takes about five minutes for your first project, with defaults that don't need tuning. Find your stack below to see exactly what that looks like.
Once you're running, invite the rest of your team, set up SSO so new teammates can sign in with the identity provider you already use, and get alerts in Slack, Discord, email, or wherever you're already collaborating. Connect errors to GitHub, Linear, or Jira if that's where you track issues.

Team and Business pricing that scales with your organization
Team plans start at $26/month with unlimited users, and every plan includes SOC2, HIPAA, and EU data residency. When you need SSO, a BAA, or audit controls, the Business plan starts at $80/month.
Monthly error tracking reports.
Daily Honeybadger Insights ingest. Retention, alarms, and dashboards increase with this plan.
Monitors include uptime checks and check-ins.
Status pages with incident management.
Team total cost
$286 when paid annually
Business total cost
$880 when paid annually
*Insights retention, alarms, and dashboards increase with the selected Logging & Performance plan.
No credit card required
Need more than the Business plan?
Honeybadger's Business plan includes unlimited users, projects, and teams, plus enterprise security and compliance. Have additional requirements? Talk to us.
Contact sales- High-volume pricing
- Single-tenant or self-hosted deployments
- Custom SLAs
- Dedicated account management
- Real-time support
Engineering teams love our industry-leading support
Our customers will tell you that we have the best developer-led support in the industry. Go ahead and email us right now. You'll get a fast reply from our dev team, and we'll go above and beyond to answer your questions. Business plans add priority support by phone and email.

Ben Curtis
To: Jason Charnes
Subject: Re: Uploading logs
Happy to help! And thanks for letting me know it (mostly) worked. I guess I have some debugging to do on that environment variable. :)
One last thing... make sure you run this to get Vector to start after a reboot:
sudo systemctl enable vector.serviceI put that in the gist after I sent the last email to you, so you may have done that already, but you may not have, and it doesn't hurt to do it twice. :)
Oh, and about the log prefix you mentioned... look in config/environments/production.rb for config.log_tags and comment that out. That's probably what's adding
that stuff to your logs.

Jason Charnes
To: Honeybadger Support
Subject: Re: Uploading logs
That did the trick!!
This is so awesome. Again, thank you!
"Quite possibly the best customer care I've ever received. I reached out to them to ask if they supported a certain feature (dashboards for Active Job in Rails). I got a reply within a few hours from the co-founder who added the feature for me, and guided me how to use it."
G2
Frequently Asked Questions
Got questions? Here are some common questions we hear from larger engineering teams about application monitoring:
How many developers is a large engineering team?
There’s no hard cutoff. We think of a large engineering team as one big enough to split into several teams—usually somewhere past 10 developers, with no upper limit. Honeybadger’s Business plan includes unlimited users and teams.
Is error tracking and application monitoring software a good fit for large engineering teams?
Yes. Larger teams often already run an APM tool like Datadog or New Relic, where error tracking is a secondary feature. Honeybadger works alongside those tools as dedicated error tracking, or replaces their built-in error tracking entirely.
Which error tracking and application monitoring tools work best for large engineering teams?
Teams at this size need two things from a monitoring tool: error tracking every team can use, and the access controls and compliance their company requires. Honeybadger covers both. It combines error tracking, logging, performance monitoring, and uptime monitoring with unlimited users and teams, SSO, and SOC2, HIPAA, and EU data residency.
How long does implementation take for a large engineering team?
About five minutes to install the SDK in a single project. Rolling out across multiple teams and setting up SSO takes longer, but there’s no infrastructure to provision and no lengthy procurement process to start.
What does onboarding look like for a large engineering team?
Sign up, install the SDK in your first project, and invite your team. New accounts start with a 30-day free trial, and no credit card is required. Add SSO so teammates can sign in with your existing identity provider, connect alerts and issue tracking to the tools each team already uses, and add projects as needed.
What does error tracking and application monitoring cost for a large engineering team?
Team plans start at $26/month with unlimited users, and every plan includes SOC2, HIPAA, and EU data residency. Business plans start at $80/month and add SSO, a BAA, and audit controls. Both bill on usage, not per seat or per host, so adding people doesn’t add to your bill.
What usage limits and data retention come with the Business plan?
The Business plan starts with 50K errors/mo, 100 MB/day of log and event ingest, 5 monitors for uptime checks and check-ins, and 1 status page. You can raise each limit as you grow. Business keeps error data for 180 days and Insights data for up to 60 days, depending on your ingest plan. Compare the limits for every plan.
What does the Business plan add besides SSO, a BAA, and audit controls?
Business adds unlimited teams, priority support by phone and email, advanced alert routing, rate-based escalation, and error volume anomaly detection. It also adds custom per-project retention limits, S3 archiving for Insights events, uptime checks every minute with custom timeouts, and private status pages with incident management and email subscriptions.
Is it worth the investment for a large engineering team?
Yes. ClickFunnels cut its error monitoring costs by 33% by switching to Honeybadger, while giving its 25-person engineering team the confidence to deploy 15+ times a day. For most teams, the bigger return is engineering time: fewer hours spent tracking down what broke and who should fix it.
What should large engineering teams look for when evaluating an application monitoring platform?
Start with four questions: How much work is it to set up and maintain? Can everyone access the same tools? Does pricing grow with usage, or with every host and teammate? Does it support your SSO and compliance requirements?
Trusted by engineering teams like yours
Tens of thousands of developers use Honeybadger to monitor web apps in production. Here's what they had to say:
"We've looked at a lot of error management systems. Honeybadger is head and shoulders above the rest and somehow gets better with every new release."
"I'd be remiss if I didn't point out that every time someone here at UserTesting reaches out to you, we are dazzled by your prompt response and excellent service."
"Testing out the new Insights feature and it's honestly pretty great. It's like Splunk without having to use Splunk. I love lightweight observability tooling."
Start monitoring across your team
No credit card, no sales call, no procurement process to start. Sign up, install the SDK, and invite your team today.