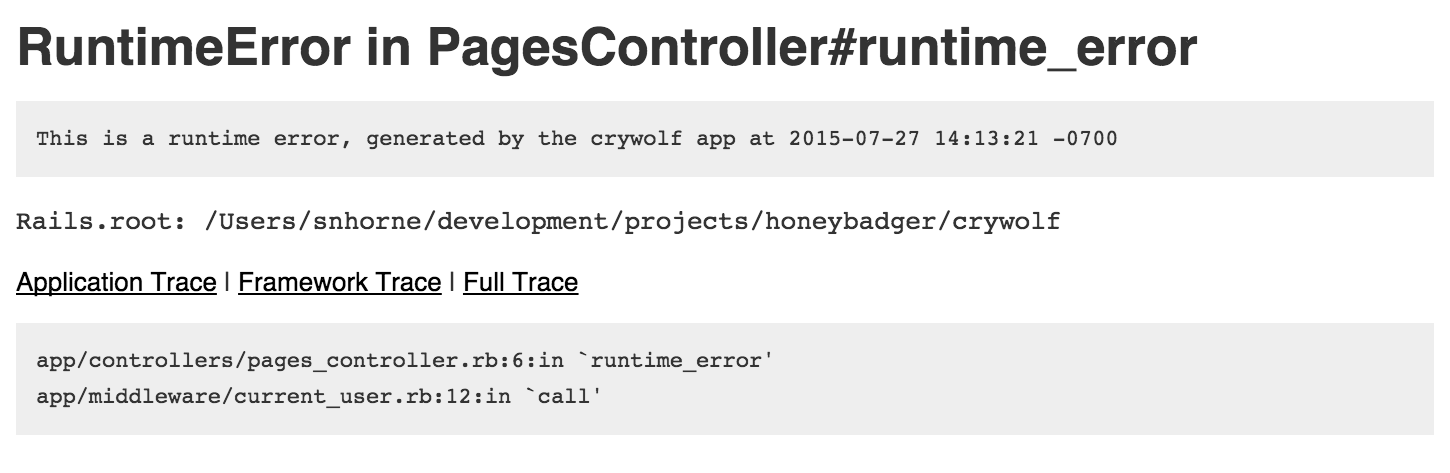
One of the nice things about working with rails is that when something goes wrong in development, you get a really nice error detail page. You get a nice backtrace, with the parts relevant to your app highlighted. You can see the params that got posted, as well as inspect environment and session variables.
Today we're going to take a look at how these fancy error pages work.
Cracking open Actionpack
The file we're going to be mostly concerned with today is actionpack/lib/action_dispatch/middleware/debug_exceptions.rb. It does most of the heavy lifting when it comes to displaying those development mode error pages. If you're curious about where the production mode error screens come from, check out public_exceptions.rb.
Rack Middleware
If you're not familiar with rack middleware, the concept is simple. It allows you to intercept HTTP requests before they get to your app, and to intercept the app's output before it goes back to the user.
Here's a simple middleware that doesn't do anything interesting.
class MyMiddleware
  def initialize(app)
    @app = app
  end

  def call(env)
    @app.call(env)
  end
end
Rescuing all exceptions via rack middleware
Any exception that occurs in your app occurs as a result of calling @app.call(). So rescuing all exceptions in a rack app is as simple as adding a rescue clause to the middleware.
def call(env)
  @app.call(env)
rescue StandardError => exception
  # this is a method we have to provide to generate the exception page
  render_exception(env, exception)
end
Anything returned from the call method will be treated as if it were a normal web page. So the content returned by render_exception replaces the original response.
Rendering the exception
I've excerpted the render_exception method from ActionDispatch::DebugExceptions. As you can see, it simply pulls the relevant data from the exception and feeds it into an ERB template.
def render_exception(env, exception)
  wrapper = ExceptionWrapper.new(env, exception)
  log_error(env, wrapper)

  if env['action_dispatch.show_detailed_exceptions']
    request = Request.new(env)
    template = ActionView::Base.new([RESCUES_TEMPLATE_PATH],
      request: request,
      exception: wrapper.exception,
      application_trace: wrapper.application_trace,
      framework_trace: wrapper.framework_trace,
      full_trace: wrapper.full_trace,
      routes_inspector: routes_inspector(exception),
      source_extract: wrapper.source_extract,
      line_number: wrapper.line_number,
      file: wrapper.file
    )
    file = "rescues/#{wrapper.rescue_template}"

    if request.xhr?
      body = template.render(template: file, layout: false, formats: [:text])
      format = "text/plain"
    else
      body = template.render(template: file, layout: 'rescues/layout')
      format = "text/html"
    end
    render(wrapper.status_code, body, format)
  else
    raise exception
  end
end

def render(status, body, format)
  [status, {'Content-Type' => "#{format}; charset=#{Response.default_charset}", 'Content-Length' => body.bytesize.to_s}, [body]]
end
Other uses
You can use this rack middleware trick to do lots of interesting things with exceptions. Here at Honeybadger, we use it to intercept errors and record them to our API. Here's the code we use to do it:
def call(env)
  config.with_request(::Rack::Request.new(env)) do
    begin
      env['honeybadger.config'] = config
      response = @app.call(env)
    rescue Exception => raised
      env['honeybadger.error_id'] = notify_honeybadger(raised, env)
      raise
    end

    framework_exception = framework_exception(env)
    if framework_exception
      env['honeybadger.error_id'] = notify_honeybadger(framework_exception, env)
    end

    response
  end
ensure
  Honeybadger.context.clear!
end


