Top 10 error monitoring companies in 2023
It’s well known that errors are inevitable in software development. Even with superior test coverage, clean code, and the most experienced developers, bugs still occur.
Therefore, the question isn’t whether errors happen, but what should be done about them. A study examined hundreds of bugs in several popular open-source projects, including Cassandra, HBase, HDFS, MapReduce, and Redis. Of the 48 errors found, a whopping 92% were caused by bad or missing error handling! Proper error-handling is crucial, but having the right error monitoring tool in place to help identify and resolve errors quickly is also important.
In this article, we’ll cover some of the most popular tools developed to help ensure you're set up to monitor errors. Please note that some features and pricing may have changed after this article was written.
Things to Consider
When determining which error monitoring service might be best for you, here are a few things to keep in mind:
- Budget - Of course, pricing is important! How much money are you able or willing to spend, and which company offers the most competitive pricing structure that meets your needs? Almost all the companies highlighted below offer a free tier that will allow you to try out the service, but from there, the pricing varies.
- Features - What features are most important to your use case, and which company best services these needs?
- Documentation/Support - How much documentation and support is available? How well known is the product? For example, can you find support outside of what the company itself provides via other users, blog posts, social media, conference talks, YouTube, etc.?
- Integrations - Which product integrates the most seamlessly with the tools you already use for other purposes, such as project management, and communication?
Honeybadger
Pricing
Honeybadger offers a fifteen-day free trial with no credit card required. From there, Honeybadger has four tiers. The basic tier is free and includes 1,000 errors per month, a fifteen-day retention period, and three users. With the free tier, you will have access to exception monitoring, uptime monitoring, and check-ins. It could be a perfectly suitable tier if you have a small project or company. The next tier is the "Team" tier, which starts at $39/month. The cost is determined based on the number of errors per month, with up to 150K/month included. The pricing scales again at 600K errors/month, then 1.8M/month, and finally, 3.6M/month. The retention period for the basic plan is increased to 90 days, and you can have unlimited users. The "Business" tier also has a price that scales based on the number of errors per month, and up to 150K/month costs $120. This tier is likely a good choice for a medium-sized company, as SSO is included, as well as custom sign-in pages, auditing controls, and priority support. The "Enterprise" tier is the most expensive and starts at $3,000 per month. With this plan, you can have custom SLA's, receive a dedicated account manager, and either utilize a single tenant or self-host. The pricing can be a bit confusing, so I recommend checking out the plans here.
Features
Some of the noteworthy features I found while exploring Honeybadger error-tracking are as follows:
- The ability to jump from the error backtrace directly to editing the file in GitHub. Once you fix and commit, Honeybadger will automatically resolve the error on your next deployment.
- All plans include "check-ins". This is an awesome way to monitor cron jobs. Once configured, your processes will report back to indicate that they're alive and well, and should a check-in go missing, you'll receive an alert. Silently failing cron jobs will no longer go unnoticed! You can read more about this feature here
- Custom status pages. Honeybadger comes with the ability to create your own status pages out of the box, using your own domain and even connecting to your social media sites, such as Twitter.
- Uptime monitoring. Honeybadger automatically monitors your endpoints from five different locations around the world. When combined with status pages, this is an excellent combo of features that gives you and your customers peace of mind.
Documentation/Support
The Honeybadger docs are well-organized and provide plenty of screenshots to help you get set up correctly. The company itself has been around since 2012. It’s pretty well established in the space, so there is a reasonable amount of other online resources available, too.
Integrations
You'd be pretty unlikely to find a tool that you can't integrate with Honeybadger. Don't believe me? Check out the following graphic:

Instructions on how to integrate with these other third-party apps can be found in the docs.
Sentry
Pricing
If you're simply curious to see what Sentry is like, they have a Sandbox site that you can play around with here. Sentry offers three pricing tiers, with the first one being free. It includes 5K errors, 10K transactions, 1GB attachments, and a 30-day data retention period. The features are slimmed down with this tier. For example, you can receive e-mailed issue alerts and workflow notifications but can’t integrate Sentry with other services. You also can’t utilize all of the visibility features that other plans provide. The "Team" tier starts at $26/month and includes integrations, unlimited members, up to 50K errors, 100K transactions, and 1GB attachments per month, as well as a 90-day data-retention period. I recommend checking out their pricing page, as you can use a slider to get a better sense for the cost based on volume. The "Business" tier starts at $80/month, and its key benefits are advanced analytics, SAML support, custom dashboards, and full compliance (BAA, HIPAA, SOC2, and ISO 27001.) Finally, there is an "Enterprise" tier that you'd need to call to inquire about pricing, but it includes many more options for customization and dedicated support.
Features
Some of the noteworthy features I found while exploring Sentry error tracking include the following:
- Distributed tracing allows you to identify issues in one project that might be causing a downstream effect, such as a slow API call or slow database queries. Sentry has a pretty nifty UI that helps you track down these issues, and there is even a sample transaction that you can check out here.
- Sentry is coming out with "Session Replay" very soon. This will record and reproduce users’ interactions on your site so that you can see all of their interactions, including page visits, mouse movements, clicks, and scrolls. If you're familiar with tools like Hotjar, it will probably be similar. If you'd like to join the waitlist or read more about it, check it out here.
- It’s not a feature, but the customer list of Sentry is pretty impressive. Here is a sample of some well-known companies that utilize Sentry for their error monitoring:
Documentation/Support
Sentry really shines in documentation and support. In addition to providing the typical docs, which are very thorough and complete, Sentry also has an entire portion of their website dedicated to resources/education that can help level you up as a developer while learning more about Sentry. For example, here is a video about how to improve performance with lazy loading. Scattered across their website, you'll also find links to blog posts that are applicable to certain features. For example, if you're not super familiar or comfortable with distributed tracing, here is an article entitled "Distributed Tracing 101 for Full Stack Developers". Cool!
Integrations
Sentry has an impressive list of tools/companies that it integrates with, as well as ample documentation. You can read more about it here.
Rollbar
Pricing
Rollbar offers four tiers of pricing: free, essentials, advanced, and enterprise. The free version includes up to 5,000 error events per month, a 30-day data retention period, and basic features (real-time feed and alerts, error grouping, and stack traces, as well as deploy and version tracking.) The "essentials" plan is $12.50 per month and includes 25,000 errors per month and all of the basic features, as well as on-demand events and a 90-day retention policy. The “advanced” plan is $82/month and includes an event volume of up to 100K, and advanced features, including adaptive alerts, cross-project search and live feed, up to a 180-day data-retention period, and an enhanced dashboard. If you're curious to try out some of the advanced features, Rollbar offers a free 14-day trial of the advanced product version. The "Enterprise" version’s price is not listed, but it includes priority support and additional features. Similar to the other companies we've looked at, the pricing scales based on the error-event volume. You can see a full breakdown of the pricing and features here.
Features
Some of the noteworthy features I found while exploring Rollbar error tracking include the following:
- "Replays" create re-runs of requests that include the same URL, headers, cookies, etc. to reproduce it, so you can see the error through the eyes of your system.
- "Person Tracking" allows you to see the event history for any user in whom you're interested.
- Intelligent grouping - one of the features that Rollbar prides itself on is it's ability to aggregate errors in real-time utilizing an AI/ML grouping engine.
Documentation/Support
Rollbar has plenty of docs availablehere, but my initial impression is that they're not as user friendly and a bit more overwhelming compared to some of the other error monitoring options. However, Rollbar does have a Gitter community where users and engineers can interact.
Integrations
You can utilize Rollbar with almost any language (the list of SDKs is impressive!), and I am impressed with all of the other third-party tools with which Rollback integrates. You can see the full list here. That said, when I searched for documentation on how to integrate, some of the links were broken/dead, which is definitely something to keep in mind.
Bugsnag
Pricing
Unlike the other companies we've discussed so far, Bugsnag has only three pricing tiers: "lite", standard, and enterprise. The lite version starts at $0 and includes one user and up to 7,500 events per month. The data retention period is 60 days for both the lite and standard versions. The lite version includes all of the same alerting as the other tiers, as well as most of the error monitoring features. The "standard" plan starts at $59/month, includes up to five seats, and starts at 150K events per month. The greatest benefits of the standard plan is that it includes custom notifications, SAML single sign-on, advanced search, and additional features related to application stability management. The "enterprise" version does not have a price listed but includes priority support, user audit logs, and custom data retention. A full breakdown of the pricing tiers is available here.
Features
Some of the noteworthy features I found while exploring Bugsnag include the following:
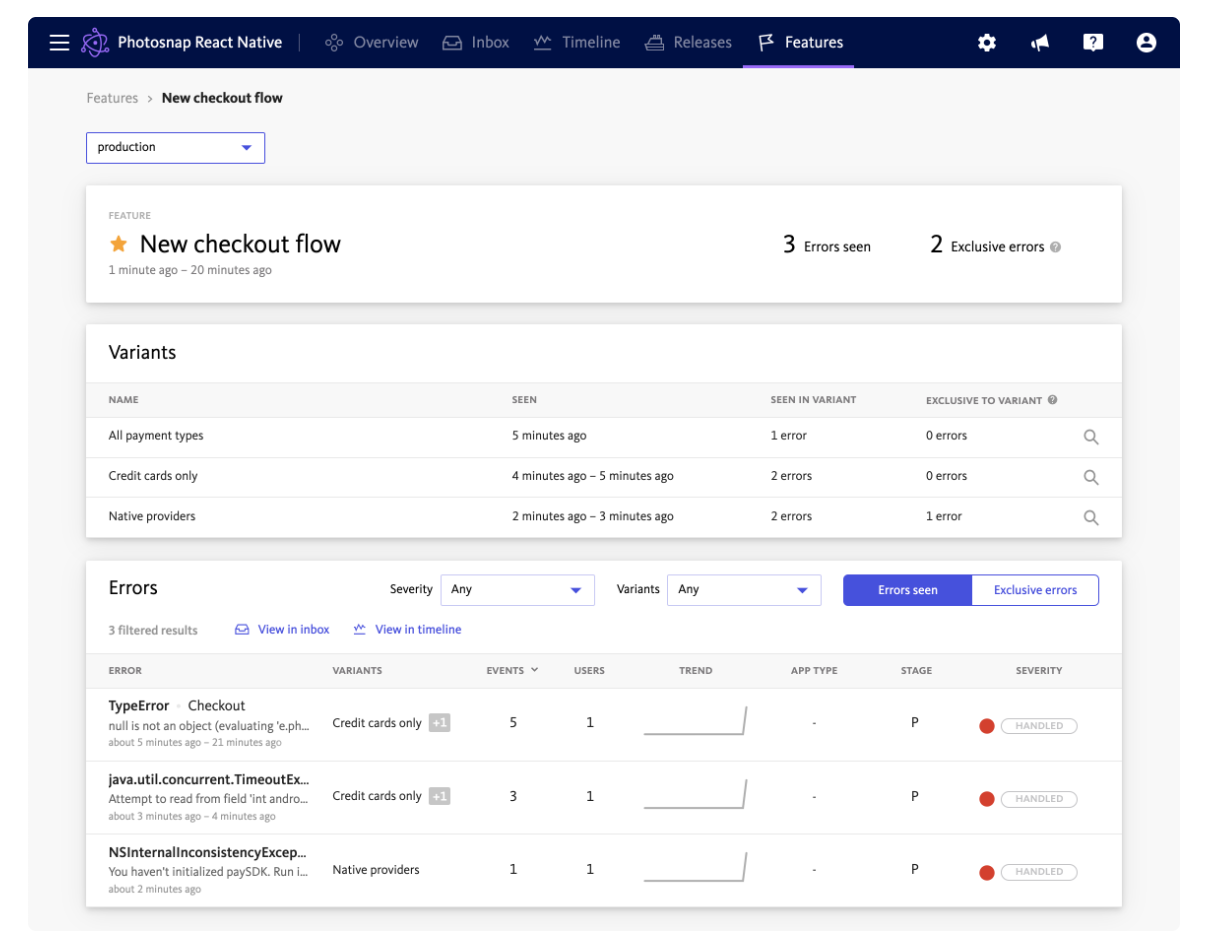
- A "Features" dashboard that allows you to monitor errors impacting feature flags and experiments that are running in your app.
- Bugsnag also provides a "Stability score" to measure the stability of your releases; it is ultimately the percentage of user sessions in a release that were crash free. This is an easy, quick indicator to quickly see the health of your application, and if you want to dive deeper, Bugsnag released a "Stability Center" dashboard view that allows you to see a holistic view of multiple applications. The "Stability center" dashboard was rolled out in 2020, and you can read more about it here.
Documentation/Support
Similar to Rollbar, I found the Bugsnag docs to be a bit more confusing and less user friendly than some of the other companies, as it took me awhile to find the information I was looking for. You can view the docs here.
Integrations
Bugsnag offers a variety of integrations, and most of the big names are covered. You can view a full list here. Some of the icons link to more information and others don't, but there is an "integrations" section in the docs here. However, it doesn't appear to cover all of the third-party tools listed on the webpage, so finding specific instructions for one of the smaller third-party tools might be difficult.
Airbrake
Pricing
Airbrake offers three tiers, plus a free trial that includes all features, such as unlimited errors, performance-monitoring events, and 30-day data retention. The "Dev" tier is $0 per month and includes one user, two projects, an account dashboard, advanced search filters, unlimited integrations, and deployment tracking. The "Basic" tier is $19/month, and the only difference is that you can have ten users, three teams, and up to 20 projects. Finally, the "Pro" tier is $38/month and includes unlimited users/teams/projects, audit logs, and spike forgiveness. Notably, Airbrake is technically two products, error monitoring and performance monitoring, which are billed as two separate products. Depending on your situation, this could be a pro or a con.
Features
Some of the noteworthy features I found while exploring Airbrake include the following:
- Airbrake provides a "Hotspot" dashboard available for all plans. Hotspots essentially help you identify where errors are concentrated; for example, what are your most error-prone files, or which pages are most affected by errors?

- While most error monitoring solutions offer a way to see how code changes affect your app's errors, I found Airbrake's "Code Insights" dashboard to be simple and easy to understand. Being able to see a diff snapshot for each deploy can be super powerful, as you can quickly identify the change that introduced new errors, as well as problematic files that were changed or touched more often.
- Mobile app - Airbrake also offers a mobile app, which can be handy for developers on the go. :)
Documentation/Support
One of the beauties of Airbrake is how quickly it is to get up and running. The website claims it can be as fast as 3 minutes after you've created your account. As such, I found the docs to be straight forward and easy to understand.
Integrations
Airbrake doesn't offer as many integrations as other tools; however, all of the popular bases are covered. It’s also impressive that each integration has its own doc. You can view instructions here.
Raygun
Pricing
Raygun wins the prize for the simplest, most straightforward pricing. Raygun has three distinct products: crash reporting, real user monitoring, and application-performance monitoring (APM). They are all priced separately based on usage. Since we're focused on error monitoring here, I'll focus on the crash-reporting product. The pricing is $40/month per 100,000 errors. You will receive unlimited team members, unlimited applications, unlimited custom dashboards, a 180-day data-retention period, inbound filters, single sign-on, deployment tracking. and customer-experience monitoring. There is a free trial, too. There is an interactive slider on this page if you'd like to get a better idea of pricing based on your volume.
Features
Some of the noteworthy features I found while exploring Raygun include the following:
- Unlimited, customizable dashboards - I love that Raygun's simple pricing means that every tier includes unlimited dashboards. Making customized dashboards with Raygun is super easy with drag and drop tiles. There are also several preset dashboards. Furthermore, no custom code or query language is required! To learn more about dashboards, you can check out this doc.
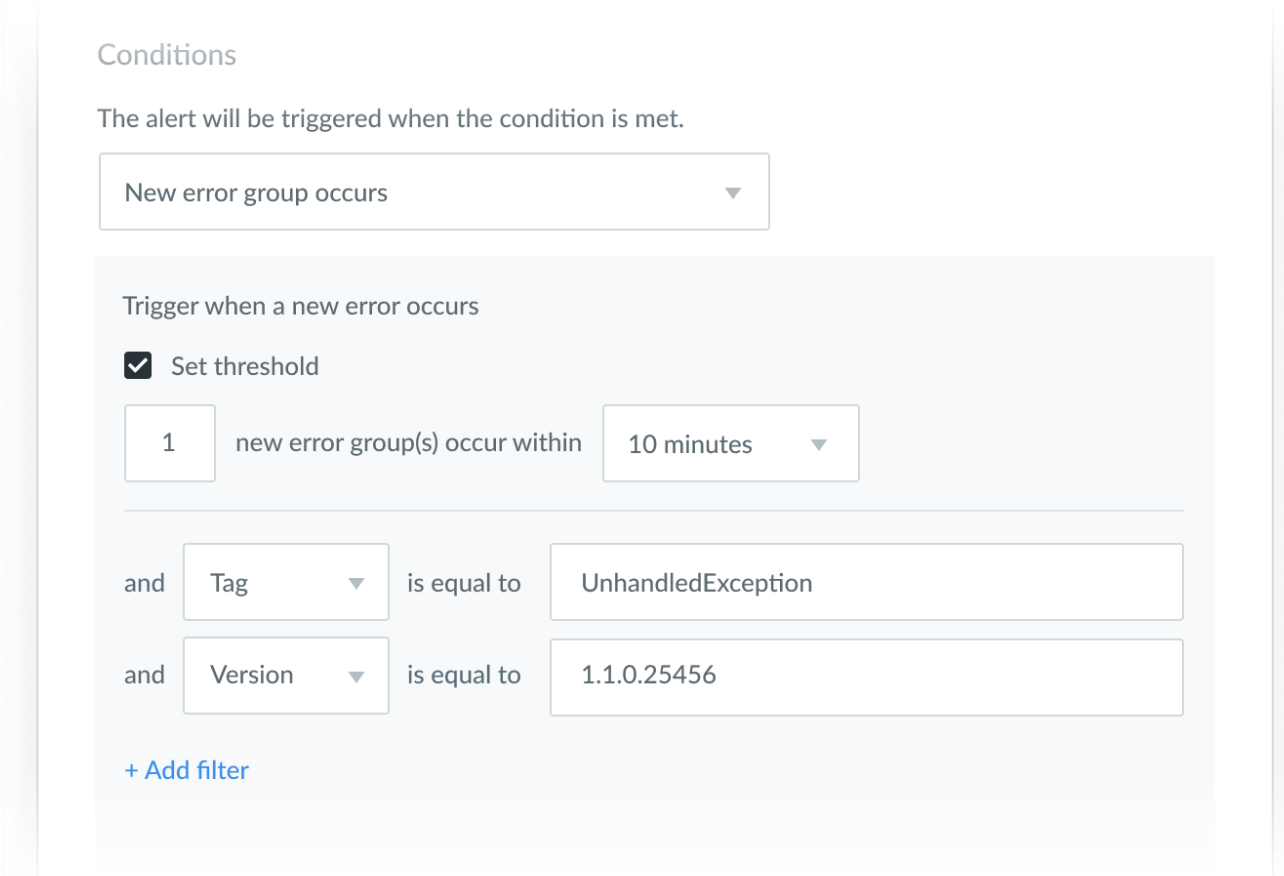
- Resolution workflows for errors are easy to set up and highly customizable. For example, you can easily set thresholds for alerts based on a certain increase in the error count, a spike in load times, or a new error occurrence.
Documentation/Support
Raygun not only has specific docs for each product (which you can check out here) but also offers lots of other resources, including customer stories, blog posts, webinars, and e-books.
Integrations
Raygun has an impressive list of integrations, and the documentation for each is really strong. You can see the list of integrations here and in the docs under "integrations" here.
Scout
Pricing
Scout is an entire "application performance-monitoring" suite. Unlike some of the other companies we've discussed that de-couple their products so that you can choose what you pay for, Scout offers it all .... but with a higher price tag. Notably, there is no free tier, but you can sign up for a 14-day free trial. The lowest-priced tier is "Basic" at $161/month and includes APM, error monitoring, database monitoring, and external-service monitoring. Up to 167,000 transactions per day and 5,000 errors per month are included. The "Plus" tier is $249/month and is essentially the same as the basic tier, but it includes up to 2888,000 transactions per day. Note that a transaction is a single web request or execution of a single background job. The "Pro" version is $499/month and includes up to 667,000 transactions/day. At this tier, you also have a dedicated account manager and SAML support. You can learn more about pricing here.
Features
Some of the noteworthy features I found while exploring Scout APM include the following:
- Intuitive, interactive dashboards. I really like the dashboards that Scout provides. In particular, you can very quickly identify anomalies that might be causing increased response times.

- Know who to contact. Backtraces are overlaid with git-blame output, so you can quickly identify and contact the developer who knows about the area of code in question.
- Ability to embed charts. Scout allows you to embed an app's overview chart inside another web page (e.g., an internal key-metrics dashboard.)
Documentation/Support
I found the official docs to be fairly lackluster given the scope of the product. However, without being a 'power user', it is difficult to know for sure whether there is enough information. However, there are specific pages for the language you are utilizing.
Integrations
I liked that Scout's integrations page is broken down by category, and each has its own page with more information. Because Scout is really more of an APM tool, you can integrate it with some of the other error monitoring tools we've discussed already, namely Rollbar, Sentry, Honeybadger, and Bugsnag.
CatchJS
Pricing
CatchJS offers three tiers, all of which include a 14-day free trial. The lowest tier is “Development”, which costs $49/month. It includes 1,000 logged errors per month, 1,000 log API calls per month, performance metrics for 100 URLs, time on page for 100 URLs, pageviews for 10,000 URLs, and one domain per account. The "Production" version is $89/month and includes 100,000 logged errors per month, 100,000 log API calls per month, performance metrics for 1,000 URLs, time on page for 1,000 URLs, pageviews for 100,000 URLs, one domain per account, e-mail notifications, screenshots, and click trials. The “Enterprise” tier is $499/month and includes 1,000,000 logged errors per month, 1,000,000 log API calls per month, performance metrics for 10,000 URLs, time on page for 10,000 URLs, pageviews for 1,000,000 URLs, 25 domains, e-mail notifications, screenshots, click trails, and priority support.
Features
Some of the noteworthy features I found while exploring CatchJS include the following:
- Time on page reporting. CatchJS monitors how long each page is visible in a browser, allowing you to know where your customers are spending their time.
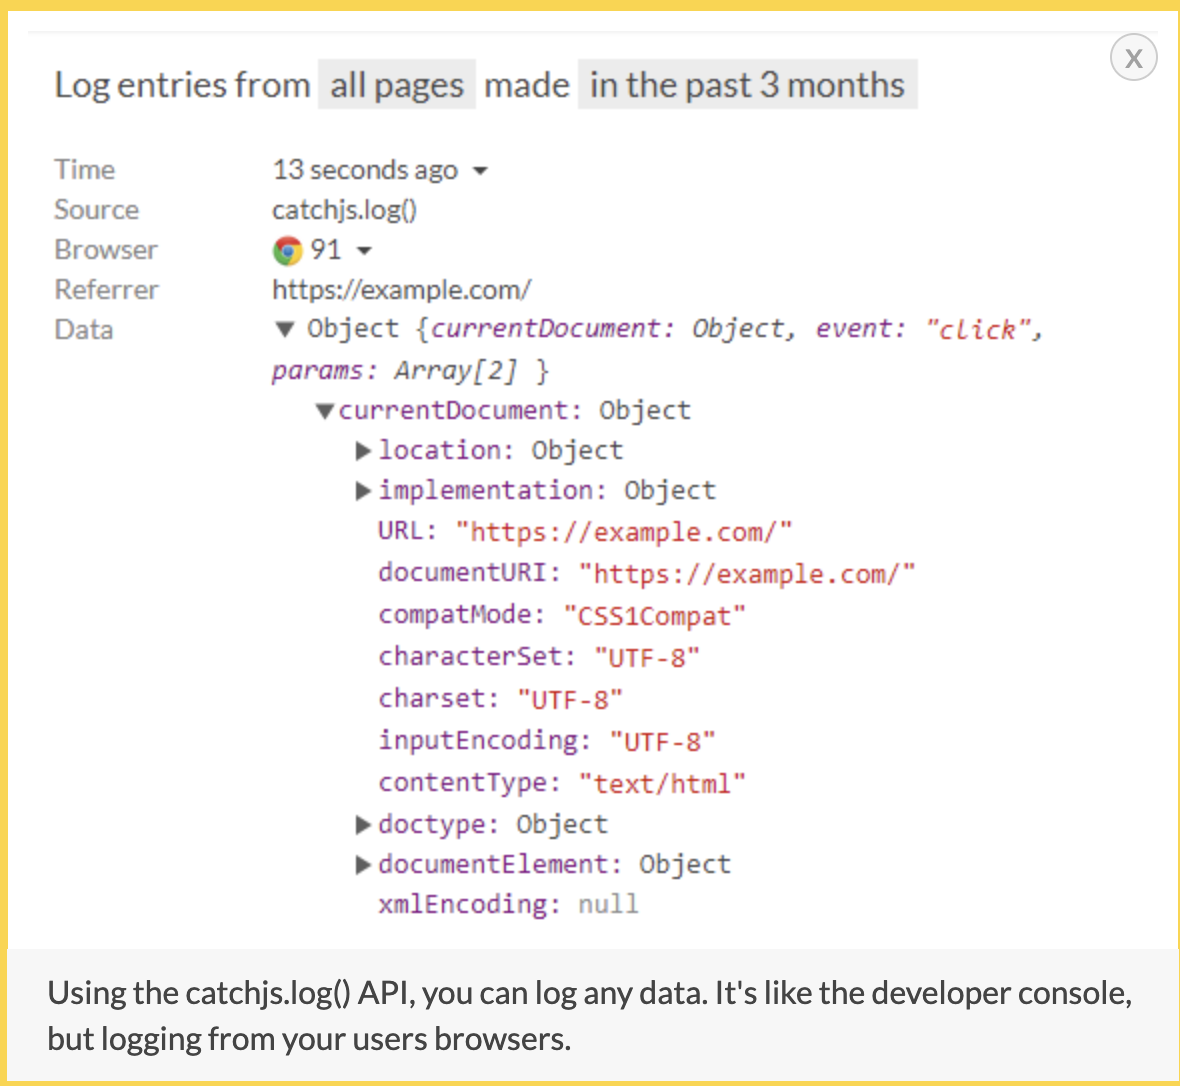
- Log anything, not just errors.
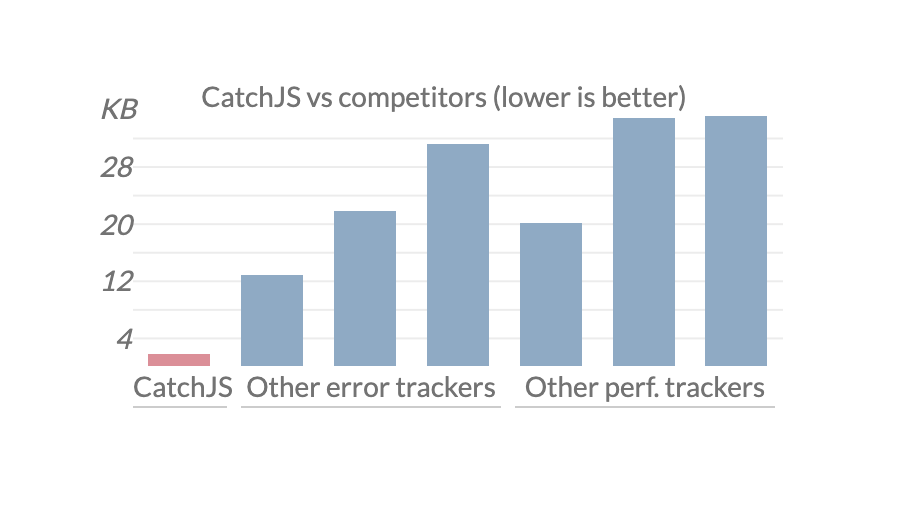
- Performance. The CatchJS script is up to 20x smaller than other competitors, less than 1.8KB after compression.
Documentation/Support
The docs are fairly sparse, but seem to cover everything that you'd need to know. CatchJS also has a blog, which is nice.
Integrations
It appears that using CatchJS with Duda, Shopify, Squarespace, Webflow, Webnode, and Wix sites is popular, as quick-start guides are available for each in their docs. However, there is no further information regarding integrations on their site.
LogRocket
Pricing
LogRocket offers a 14-day free trial that includes all features. From there, LogRocket has four pricing tiers, with the first one being free. It includes three seats, 1,000 sessions/month, a one-month data-retention policy, access to the 'core' features, and privacy controls. The "Team" tier starts at $99/month and includes five seats, 10,000 sessions/month, a one-month data-retention policy, and the same features as the free version. The "Professional" tier starts at $500/month and includes 25,000 sessions/month, advanced filtering and issues, detailed product analytics, custom seats, and data retention. The "Enterprise" pricing requires a phone call, but it includes self-hosting options, unlimited sessions, and an uptime SLA. Here is the link to read more about the pricing tiers and compare features.
Features
Some of the noteworthy features I found while exploring LogRocket include the following:
- LogRocket markets itself as a combination of session replay, error tracking, and product analytics. Their Session Replay feature is highly rated, and I found the filters and search of sessions functionality to be especially useful. You can also combine multiple filters to create "cohorts", which is neat.
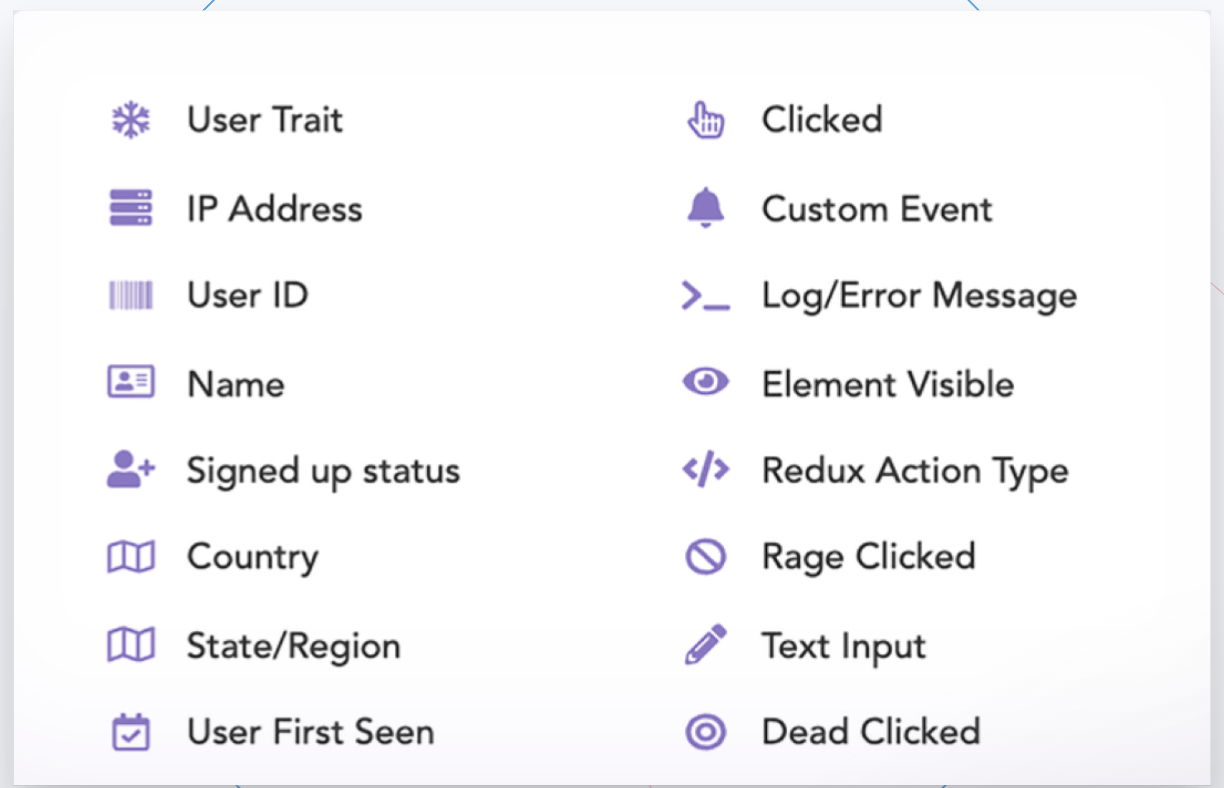
- Their product analytics suite of dashboards is nice, too, and might be very helpful depending on your app. You can easily examine common paths that lead to user drop-off, conversion funnels, dead clicks, and rage clicks that affect your conversions.
Documentation/Support
The docs are pretty thorough, as well as well organized and laid out.
Integrations
LogRocket offers plenty of integrations, including the other error monitoring tools that we've discussed, including Raygun, Rollbar, Sentry, Honeybadger, Bugsnag, and Airbrake. Each integration has its own page in the docs, which you can view here.
Flare
Pricing
Flare offers three tiers, and all features are available with a 10-day free trial. The "standard" tier costs $29/month and includes unlimited projects and users, 100,000 error occurrences, and 14-day data retention. The "Growth" tier costs $69/month, and it includes up to 300,000 error occurrences and 30-day data retention. The "Premium" tier costs $279/month and includes up to 1,000,000 error occurrences and a 30-day data retention period, as well as priority support. To learn more about pricing, you can check out this page.
Features
Some of the noteworthy features I found while exploring Flare are as follows:
- Flare was developed specifically for Laravel (PHP and JavaScript) error tracking. One of the cool features is that Flare suggests solutions and related documentation, and in local development, the Ignition error-page can automatically fix problems with a single click.
- Collaboration- Flare makes it easy to collaborate with team members. You can share your exceptions from your local environment or production.

Documentation/Support
The docs are well organized and thorough. I also really like that there is a toggle in the upper left-hand corner for "Docs" and "Videos" -- if you're a visual learner, there are several videos available to walk you through, for example, installation.
Integrations
Flare integrates with Slack, Telegram, Discord, and Microsoft Teams for notifications, as well as GitHub as a code repository.
Conclusion
Phew, we have finally reached the end of the list! You might be overwhelmed with all of the options, which is understandable. My advice is to pick out the top contenders, and give the free trials a whirl. See how quickly you're able to set up and get started. I also recommend deciding whether you're truly looking for just an error monitoring tool or a larger suite of products that includes application performance management. It might also be helpful to benchmark how many errors you have in a given month, so you can accurately estimate pricing. Overall, having a robust error monitoring tool can save time, ultimately make you money by not having downtime, and keep your users happy!

Written by
Julie KentJulie is an engineer at Stitch Fix. In her free time, she likes reading, cooking, and walking her dog.