Business intelligence (BI) is a tech-driven process for transforming raw data into actionable insights that support business decisions. These are often in the form of reports, dashboards, and charts.
Many companies offer BI software, from specialized houses, such as Tableau and Qlik, to big corporations, such as Microsoft, IBM, and Google. Although these include a complete set of analytics tools, they usually come at a cost: complexity and price.
If you are working on a Rails project and value simplicity or want to start gathering your first business metrics, then Blazer might be a good solution. With Blazer, you can write SQL queries to create dashboards with metrics and charts, perform cohort analysis, send notifications, and even run forecasts. Their motto is 'business intelligence made simple'. Additionally, as of the writing of this post, it is free.
Installing Blazer
Add blazer to your Gemfile:
gem "blazer"
Run the following commands:
rails generate blazer:install
rails db:migrate
These commands will add Blazer configurations to config/blazer.rb and new database tables that will be needed to run Blazer and save dashboards.
Finally, mount the dashboard in config/routes.rb:
mount Blazer::Engine, at: "blazer"
Do not forget that you should restrict the dashboard to authenticated users, especially in production.
If you are using Devise, you can do this directly in the routes:
authenticate :user, ->(user) { user.admin? } do
  mount Blazer::Engine, at: "blazer"
end
Blazer supports multiple data sources. I will be using PostgreSQL for this demonstration.
There is a more detailed view of the configurations in the official documentation.
Your First Metric
To show how Blazer works, I will use a bookings application with fictional data. This app will have tables, including accommodations, guests, bookings, and ratings.
For the first metric, I want to know how many days, on average, the guests stay in our accommodations. In practice, this requires consulting the bookings table and calculating the average number of days between check-in and check-out.
First things first. To create a new metric, I will click on 'New Query'.
This will open a small editor where I can write my first query with SQL:
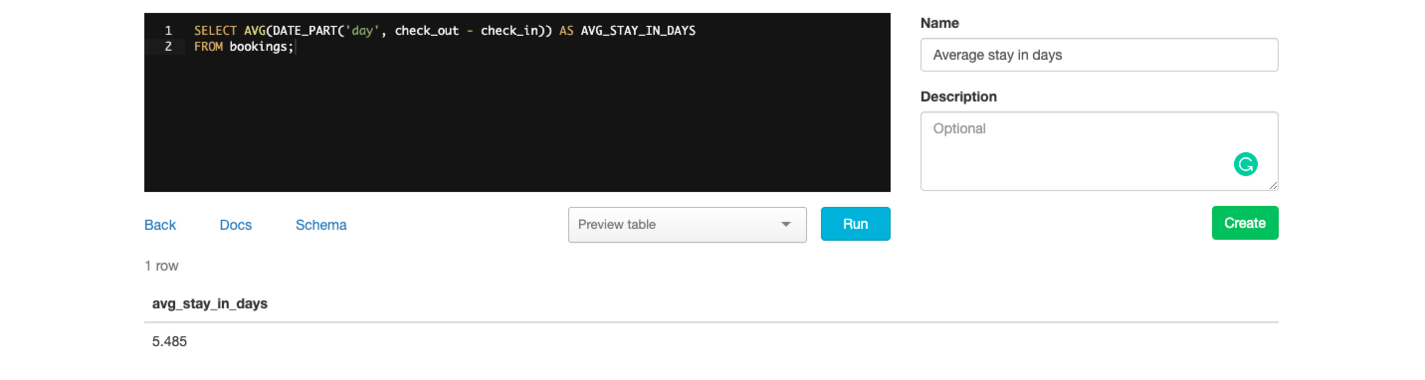 Metric 'Average stay (in days)'
Note that as a security measure, all queries run in Blazer are wrapped in a transaction that will be rollbacked in the end.
I'm happy with the result, and I find the metric valuable for the business, so I can name it 'Average stay (in days)' and save it. This will now be accessible to other admin users in the main dashboard.
When naming queries, know that Blazer supports a basic permissions model:
- Queries without a name are unlisted.
- Queries whose name starts with # are only listed to the creator.
- Queries whose name starts with * can only be edited by the creator.
At the database level, you can also create users with read-only permissions. Here is an example for PostgreSQL:
BEGIN;
CREATE ROLE blazer LOGIN PASSWORD 'secret';
GRANT CONNECT ON DATABASE dbname TO blazer;
GRANT USAGE ON SCHEMA public TO blazer;
GRANT SELECT ON ALL TABLES IN SCHEMA public TO blazer;
ALTER DEFAULT PRIVILEGES IN SCHEMA public GRANT SELECT ON TABLES TO blazer;
COMMIT;
Adding Charts
Now, let us say that I want to have a visual look at the total number of check-ins over time.
Blazer will automatically generate charts based on the types of columns returned in your query.
For example, to generate a line chart, I can just write a query that returns a timestamp and a numeric:
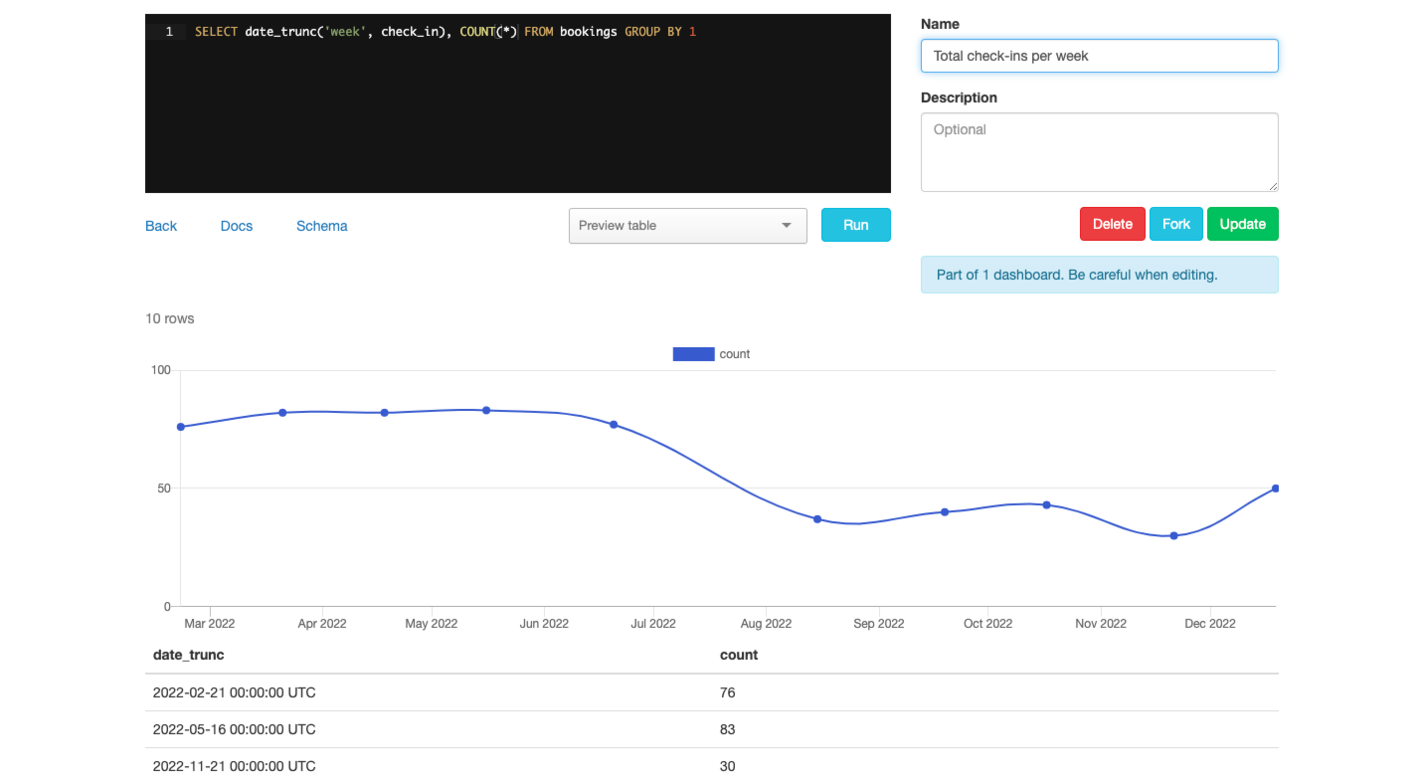 Line chart with total check-ins per week
Business-wise, I am already getting a lot of value from this chart. There is a decrease in check-ins from July to August, a behavior that is not typical for this time of year. I can also add a target line with the minimum check-ins that we should have as a business:
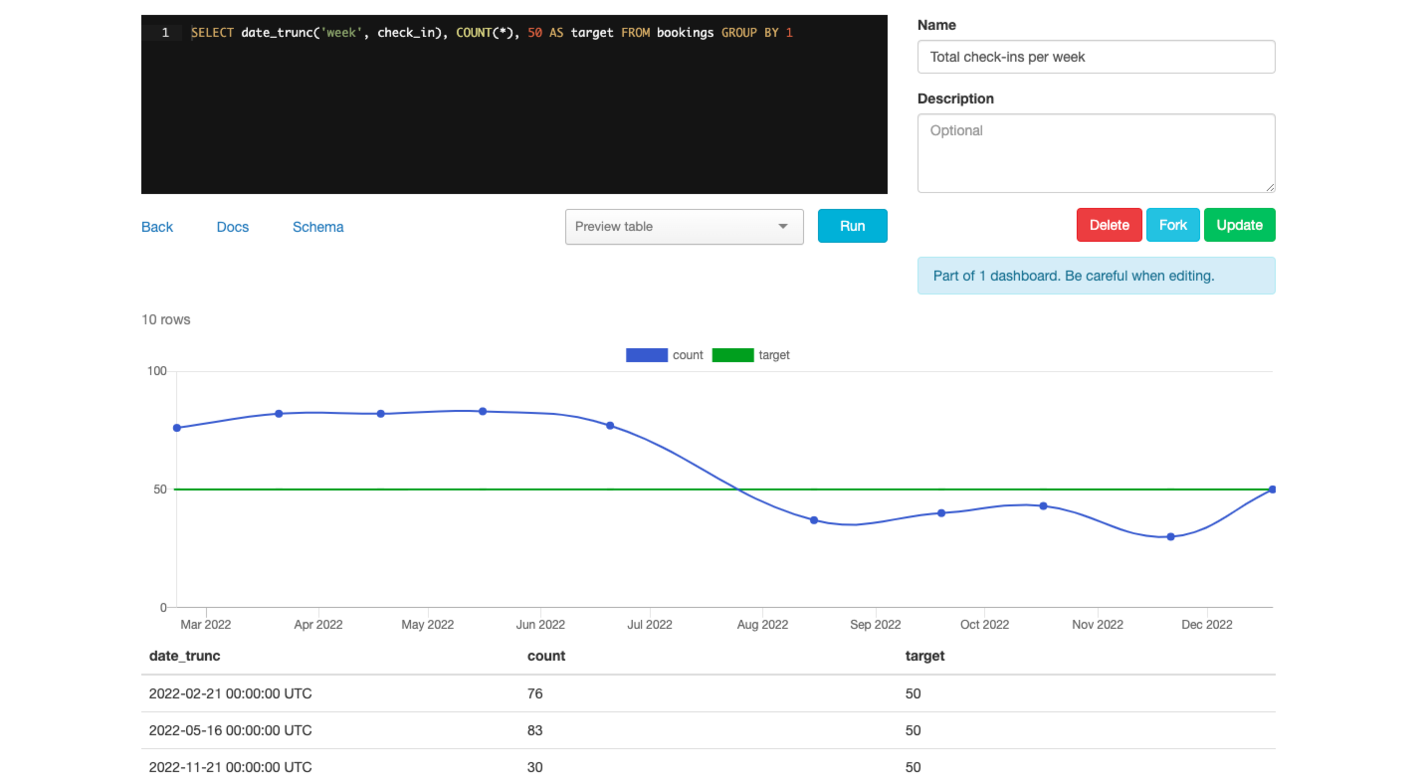 Line chart with total check-ins per week with target
Great, this graph is now ready to share. I will name it 'Total Check-ins Per Week' and save it.
Blazer supports many other types of charts, including column, scatter, and pie. It also supports maps.
Building Dashboards
Both 'average stay (in days)' and 'total check-ins per week' relate to bookings, so these two analyses can be joined together in a dashboard.
To do that, I will click the 'New Dashboard' option on the main page and choose from the chart list, which is pre-filled with all the charts/metrics we have created so far.
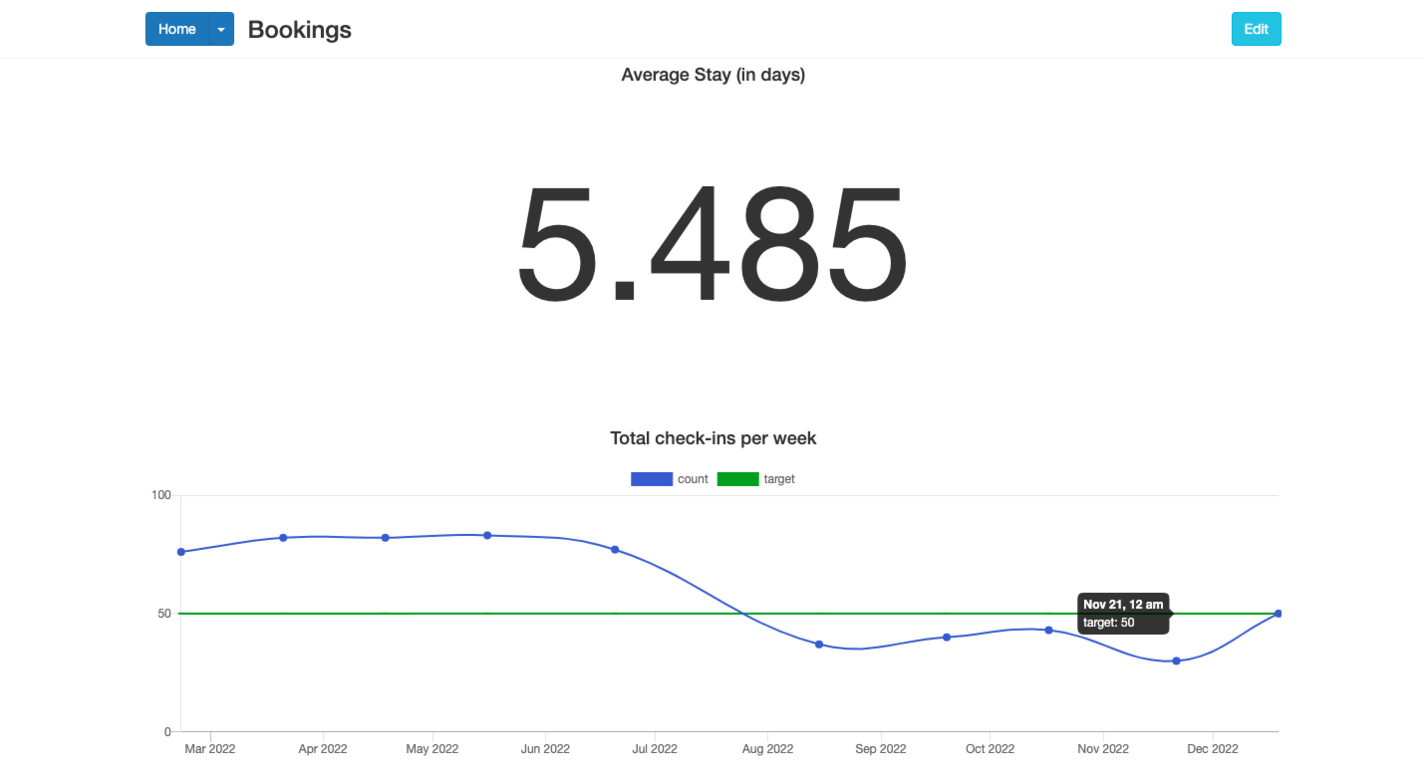 Bookings dashboard with 'Average stary (in days)' and 'Total check-ins per week'
Going Further with Checks, Cohorts, and Forecasts
Checks
You can check your data for anomalies or missing data, run these checks periodically, and even send notifications to your email or slack channel.
I want to be notified if there are ratings with no rate. To do that, I will first create a new query and save it as 'Ratings with no rate':
SELECT * FROM ratings WHERE rate IS NULL /* all ratings should have a rate */
Next, I will go to the 'Checks' area and create a new check based on this query.
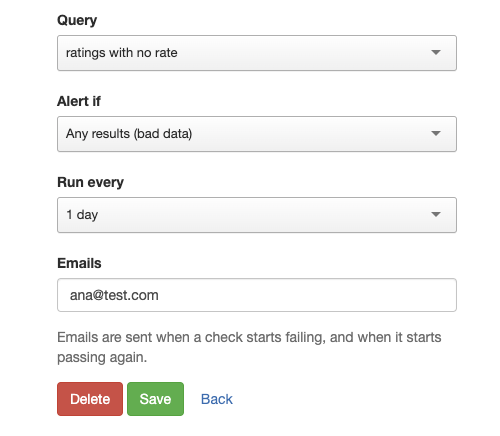 Checking if there are any ratings with no rate (bad data)
Currently, this query returns no results. This means that the check is passing, as shown on the checks list below. Anytime the query returns results, the state will change to 'failing', and I will be notified by email.
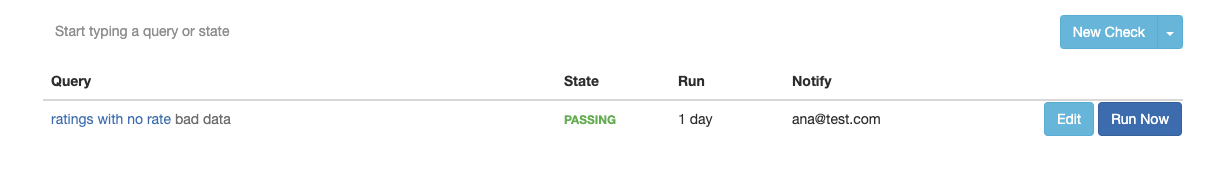 Checking if there are any ratings with no rate (bad data)
Cohorts
A cohort analysis can help you track engagement or retention over time.
To run a cohort analysis on Blazer, add the comment /cohort analysis/ to a query. The query should also return the columns user_id, conversion_time, and optionally, cohort_time. If you do not return these columns, the cohort will not work.
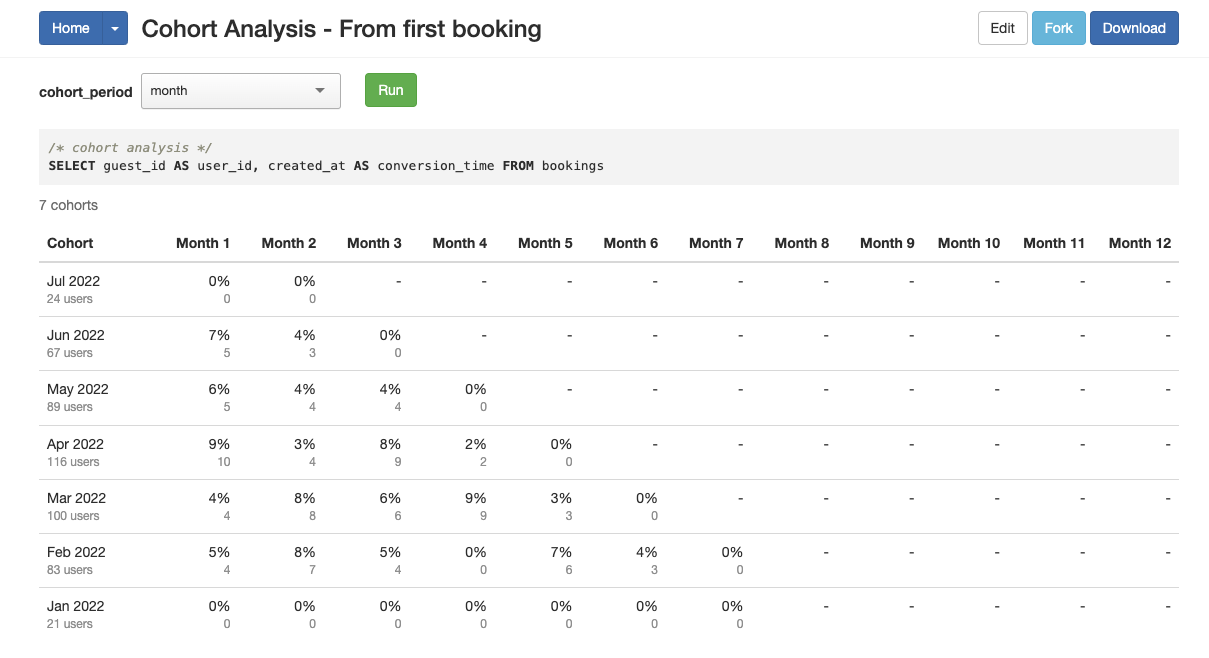 Analyzing user engagement with cohorts
Forecasts
By now, we have seen some of the main features of Blazer. However, by combining it with other gems, you can make it even more powerful.
For example, prophet is a gem, built by the same author, that will create forecasts based on a series of data.
To use it, add it to your Gemfile:
gem "prophet-rb", ">= 0.2.1"
Then, add it to config/blazer.yml:
forecasting: prophet
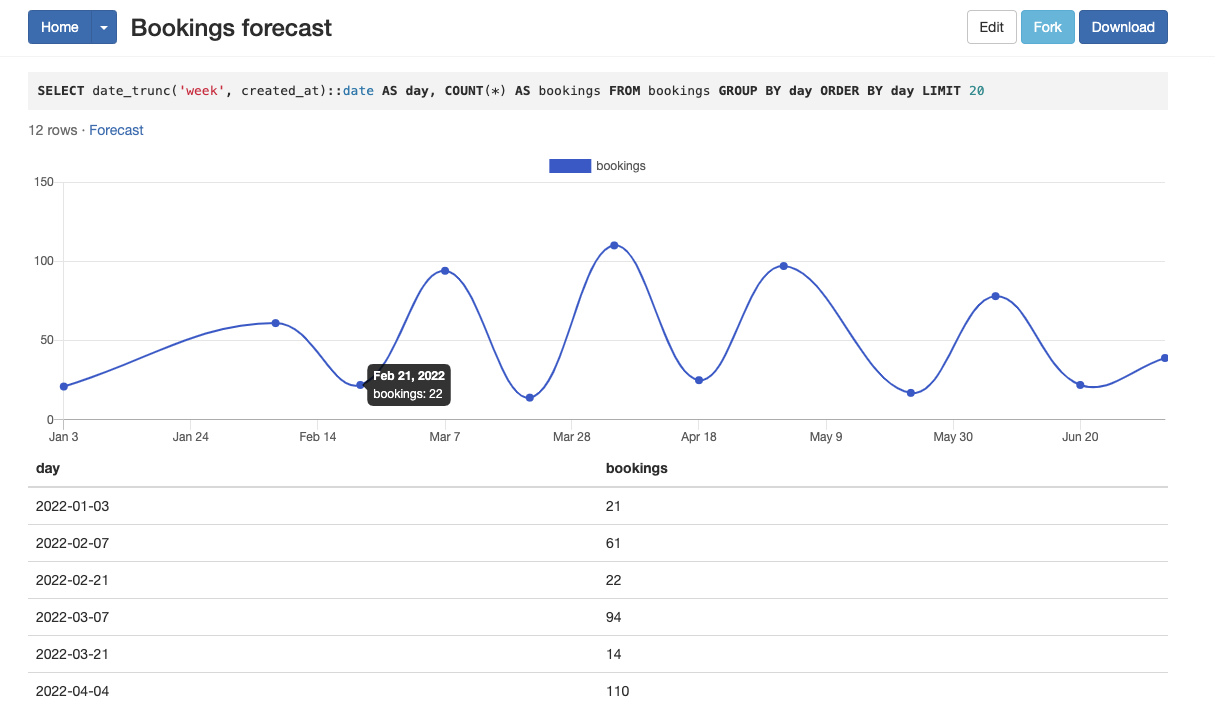
Now, whenever you write a query that returns two columns, where one is a timestamp and the other a numeric, a link 'forecast' will appear.
 Total weekly bookings
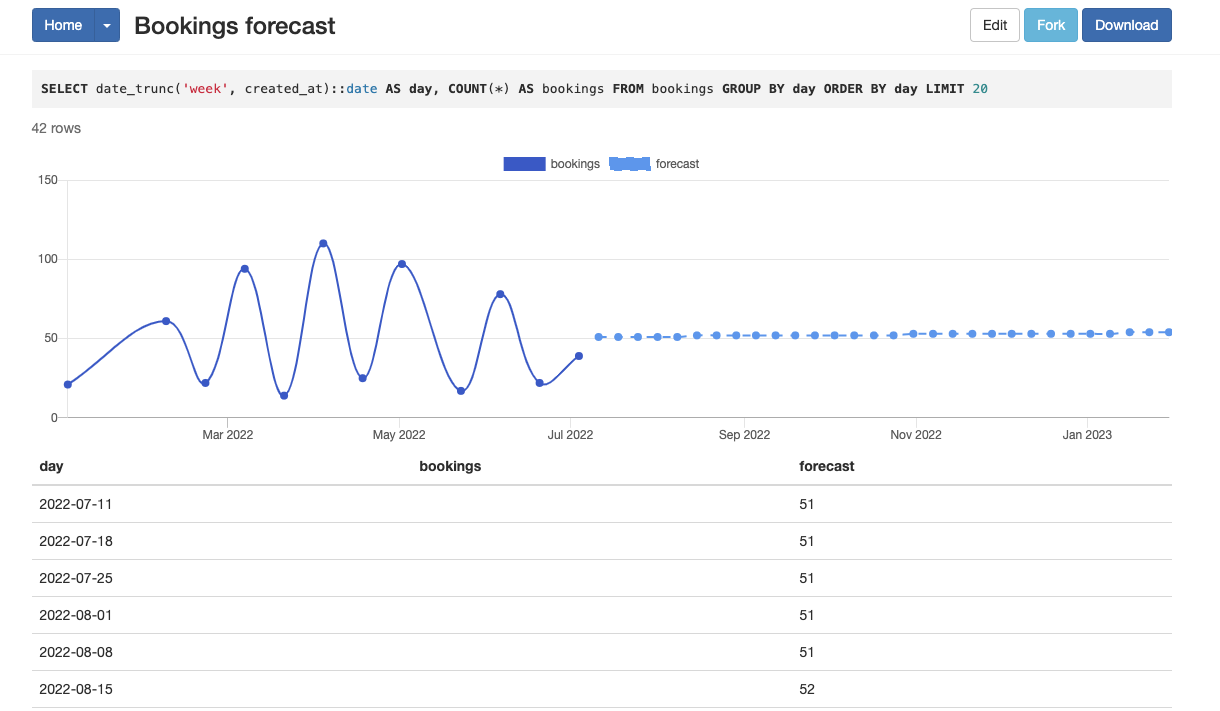 Total weekly bookings with forecast
Conclusion
Important business decisions should not be based on unvalidated ideas or opinions. Successful businesses back decisions with data. However, data is useless unless you transform it into actionable insights: data that you can consume, interpret, and incorporate into your business domains.
A business intelligence system will help you achieve that. If you are working on a Ruby project and want to start building an internal reporting system for it, Blazer is a great starting point. It is simple to install and explore. You only need to know SQL to be able to quickly set up dashboards with metrics and charts that can be read and edited by selected members of your team.
It supports multiple data sources and can also be extended with other gems to provide forecasts, for example.
Go ahead and give it a try!


