Automatic Sidekiq monitoring dashboard
When Sidekiq jobs pile up, you need fast answers. Honeybadger Insights already makes it easy to query your Rails performance data, including Sidekiq performance. But it can be hard to know where to start—until now. We just added a new Sidekiq dashboard to Honeybadger.
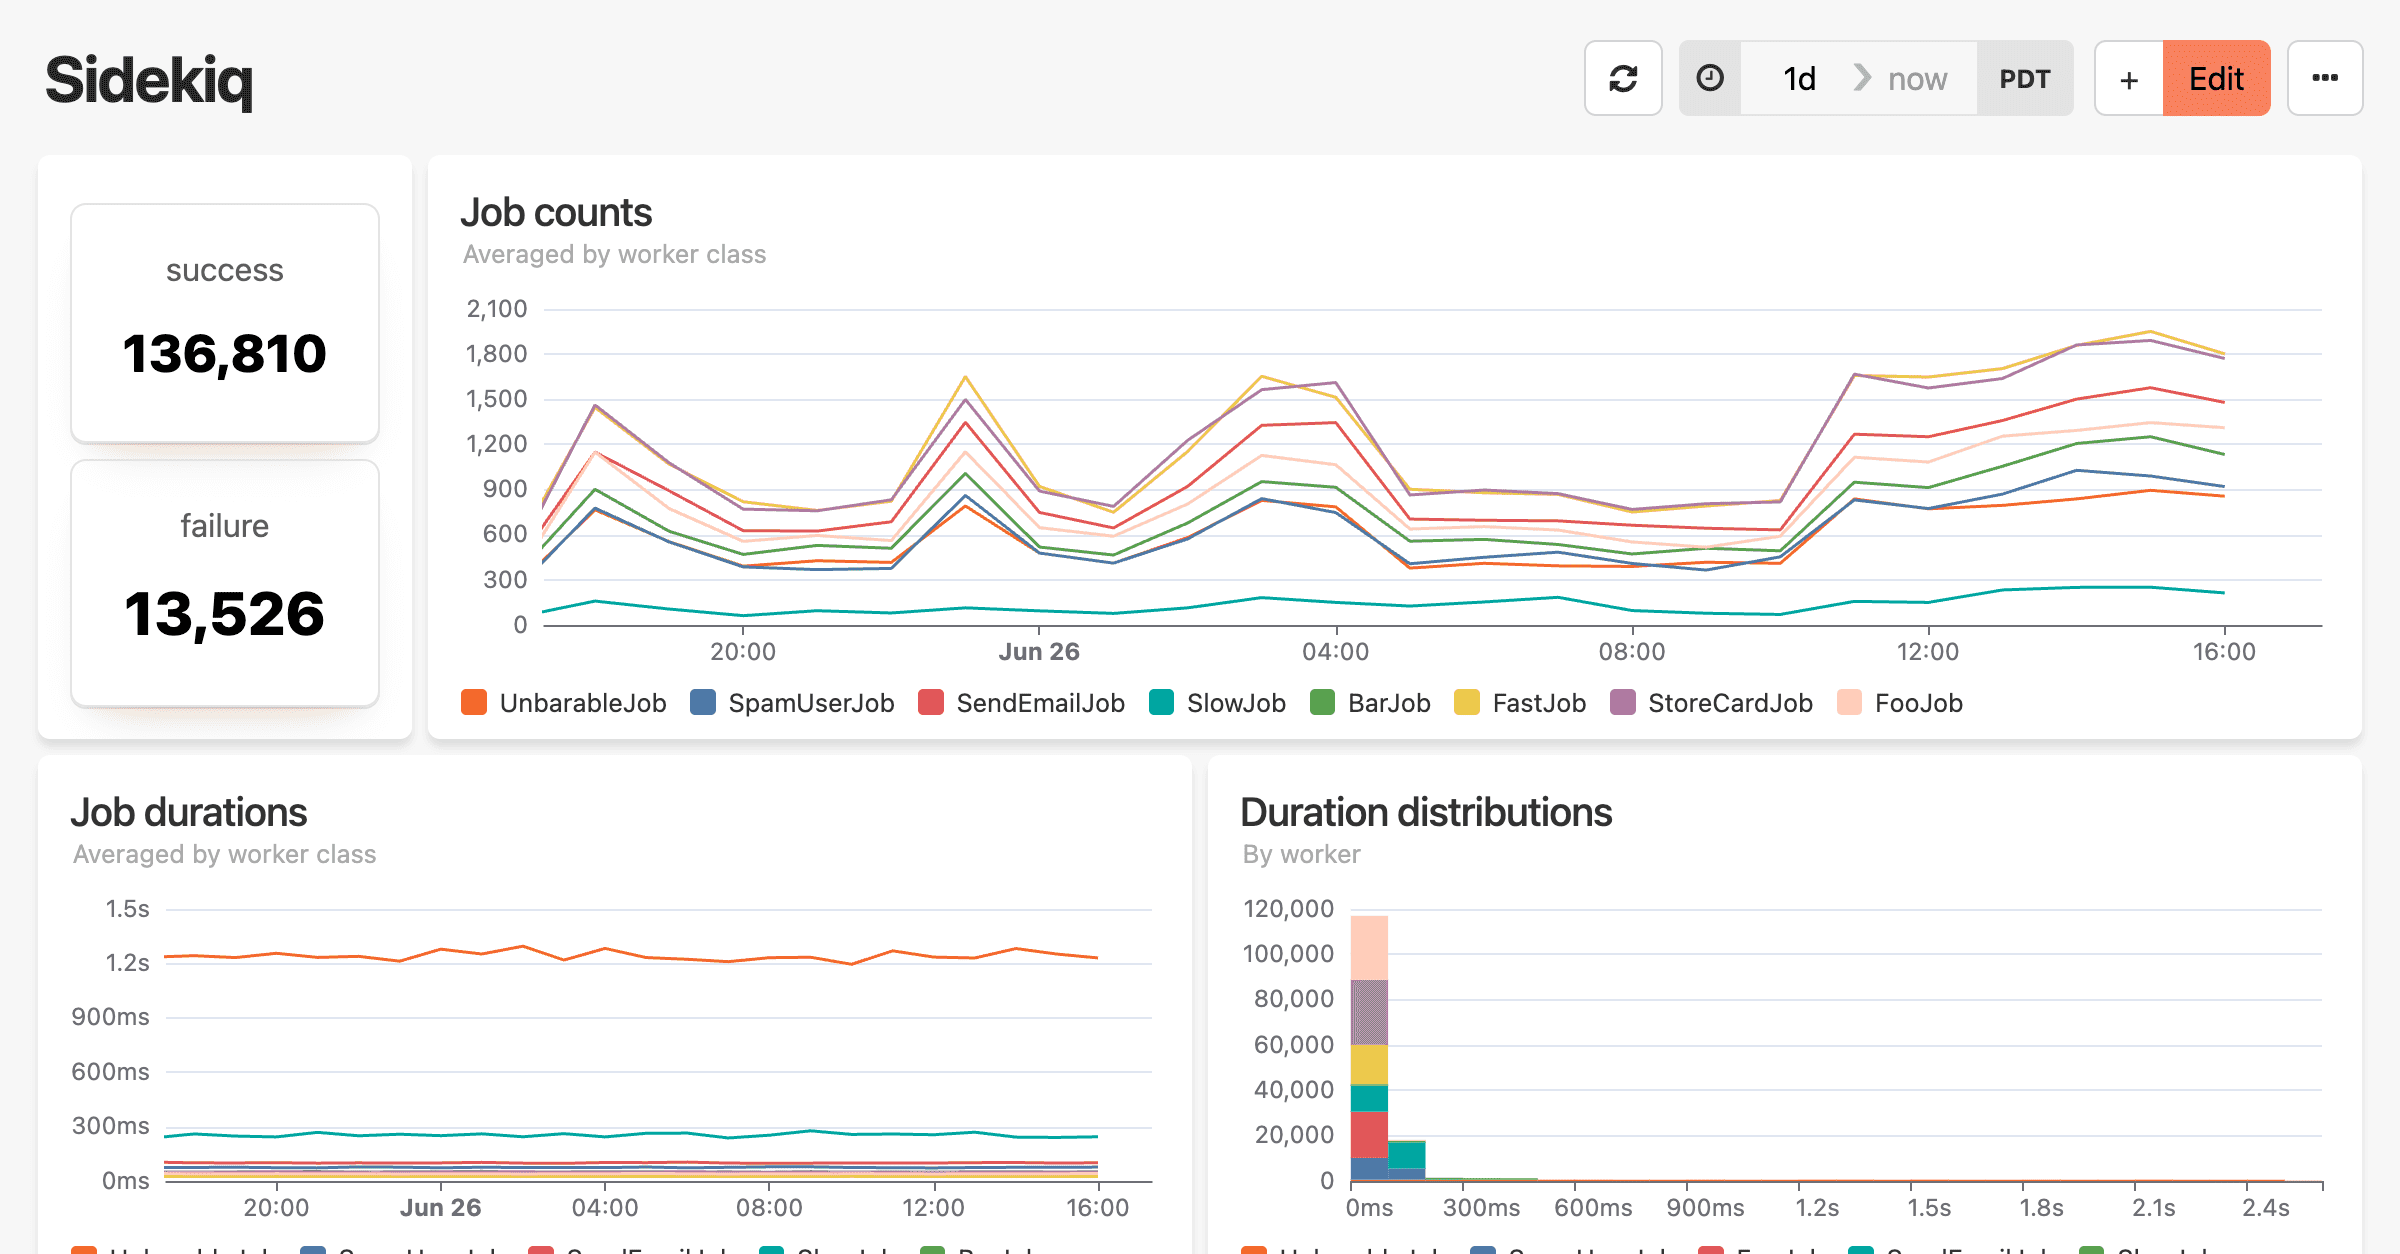
Honeybadger's Sidekiq monitoring dashboard
The Sidekiq dashboard gives you immediate visibility into your background job performance without any custom configuration, and the charts are a great starting point when investigating slowdowns and other issues. The dashboard automatically captures and visualizes your Sidekiq job performance, including:
- Job volume: Monitor job counts over time by worker class
- Performance trends: Visualize performance patterns with job durations and distributions
- Success/failure metrics: View comprehensive worker statistics with totals and averages
- Bottlenecks: Spot the 10 slowest job runs with execution details
Monitoring Sidekiq performance in Honeybadger
Honeybadger automatically instruments your Sidekiq jobs when you enable Insights in the Honeybadger Ruby gem. To get started, update to gem version >= 5.11 and enable Insights in your config/honeybadger.yml:
insights:
  enabled: true
Once enabled, select "Sidekiq" from the Ruby automatic dashboard templates in your Honeybadger project.
The new Sidekiq dashboard is available immediately for all Honeybadger accounts. Check out our Ruby gem docs for more details on HB's automatic Rails instrumentation.
Try Honeybadger for FREE
Honeybadger is full-stack application monitoring that helps developers move fast and fix things. Get set up in minutes and check monitoring off your to-do list.
Easy 5-minute setup — No credit card required