Looking to integrate Honeybadger in your Chrome Extension? Take a look at our Chrome Extension Integration Guide!
Releasing a new feature or product is always a harrowing adventure.
I’ve used Honeybadger for various projects over the last few years, and naturally, my team set it up when I came to build Sigstr. We love the ability to see what our customers are experiencing. It lets us be hyper-reactive to problems, helps our product team prioritize tasks, and provides deeper insights to our customer service team.
When my team started building Sigstr’s Chrome Extension to support our new Dynamic Campaign feature, we quickly realized the need to gain awareness into application behaviors encountered by users who installed the extension.
So I wondered how we could use Honeybadger to report errors for our Chrome extension. Here’s what we did.
Create a New Project in Honeybadger
We created a new project in our Honeybadger account so we could track the errors separately from our other projects. A new project gives us a new Honeybadger API key to use in the steps below.
Set up Honeybadger in the Code
Using the “CommonJS” examples from the Honeybadger install docs, we went about setting up the requirements needed to report notifications back to Honeybadger.
First, we added the latest honeybadger.min.js source to the root of our extension’s project. At time of build, that was https://js.honeybadger.io/v0.4/honeybadger.min.js.
Next, we made sure that Honeybadger is listed as an accessible resource in our manifest.json file. We also made sure that manifest.json listed the content.js file, which we used to include the Honeybadger source.
"content_scripts": [
    {
        "js": ["content.js"]
    }
],
"web_accessible_resources": [
    "main.js",
    "honeybadger.min.js"
]
Then, inside of content.js, we loaded the Honeybadger source into the DOM.
var s = document.createElement('script');
s.src = chrome.extension.getURL('honeybadger.min.js');
(document.head || document.documentElement).appendChild(s);
Sending Notifications to Honeybadger
Now, we’re able to use the Honeybadger library within our extension and start reporting notifications and errors back to the new project we created.
Within our main.js file for the extension, we set up a new Honeybadger configuration. We also added in context data so we can get a better handle on which users are associated with each notification.
Honeybadger.configure({
    api_key: ‘your_api_key_here’
});
Honeybadger.setContext({ user_email: ‘user_email_here’ });
Sending a Notification
With Honeybadger all set up, we created a simple test call in main.js to send a notification to our new project.
try {
    notDefinedFunction();
} catch(error) {
    Honeybadger.notify(error);
}
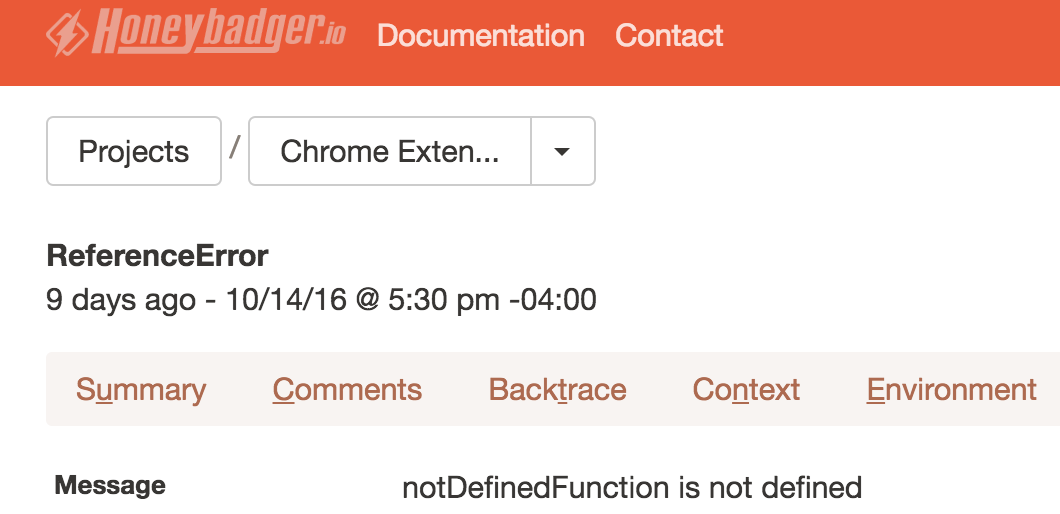
After packaging the above code into a new test version, we installed the test extension in Chrome. Executing the new tracking code results in a notification being reported to Honeybadger!


