How to add context data to exceptions in Ruby
Sometimes the standard backtrace / error message combo isn't enough. Sometimes you need extra data to locate the cause of an error. Fortunately, it's super easy to do in Ruby.
Customizing the error message
The simplest way to add contextual information to your errors is to add it to the exception's message. In the example below I'm catching an exception and re-raising it with a new message:
begin
  raise "foo"
rescue => e
  raise e.class, "bar"
end

# RuntimeError: bar
A good use case for this approach might be when you're rendering a template. Any exception that happens inside the template doesn't know the template's filename. But that's pretty important information for you to know when debugging.
Here's an example of how you could rescue template errors and prepend the file name to the message.
filename = "mytemplate.erb"
template = File.read(filename) # Contains "<% 1/0 %>"

e = ERB.new(template)

begin
  e.result
rescue => e
  raise e.class, [filename, e.message].join(": ")
end

# ZeroDivisionError: mytemplate.erb: divided by 0
Wrapping the exception
Another option for including contextual information in exceptions is to create a custom exception. Since exceptions are just classes like everything else in Ruby, you can add as many attr_accessors as your heart desires.
Here's how that might look:
TemplateError < StandardError
  attr_reader :filename

  def initialize(msg, filename)
    @filename = filename
    super(msg)
  end
end

begin
  ERB.new(template).result
rescue => e
  raise TemplateError.new(e.message, filename)
end
Using Honeybadger's context feature
Ok, ok. I had to put this in, since Honeybadger has a pretty slick way to add contextual information to your exceptions. Instead of modifying the exception object, you simply use the Honeybadger.context method from anywhere in your application.
class ApplicationController

  ....

  def find_current_user
    user = ...
    Honeybadger.context(user_id: user.id, user_email: user.email, user.scope: "user")
  end

end
When an exception happens, the context data is reported along with it. You can then view the data along with other exception data in our web or mobile apps.
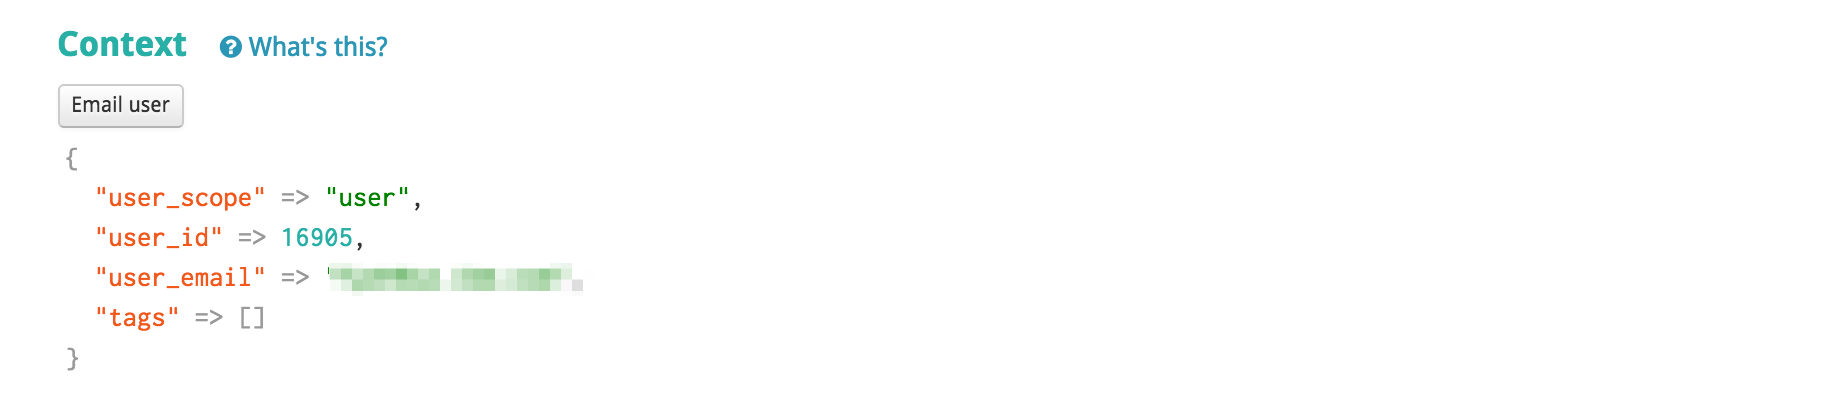 Honeybadger's context feature lets you attach whatever info you need to your exceptions without much code.
Written by
Starr HorneStarr Horne is a Rubyist and former Chief JavaScripter at Honeybadger. When she's not fixing bugs, she enjoys making furniture with traditional hand-tools, reading history and brewing beer in her garage in Seattle.