Monitoring for non-application errors on Heroku
When your service fails due to an exception in your application code (Ruby, Go, Elixir, etc...), Honeybadger alerts you. Unfortunately, application errors are only half the story. What happens when something goes wrong outside of your application code? You probably use something like our Uptime Monitoring to be alerted of catastrophic outages such as when EC2 is down, DNS fails, or one of the other myriad scenarios play out.
On Heroku there is an entire class of errors which can happen before your application code even runs (or sometimes when it times out or crashes fatally). That means that if you're using a standard exception tracker you may be finding out about these types of errors when your entire app is down, or worse: when they happen so occasionally that nobody notices them.
Introducing Heroku platform monitoring
Honeybadger now monitors for Heroku platform errors. That means that in addition to exception monitoring, we can alert you in realtime when your Heroku apps have errors which are outside of your application code. What kind of errors are we talking about? Here are some of the more common ones:
- H10 - App crashed
- H11 - Backlog too deep
- H12 - Request timeout
- H13 - Connection closed without response
- R14 - Memory quota exceeded
Check out this Dev Center article for a full list of errors we'll report.
What it looks like
A platform error will show up in your Honeybadger account just like your application errors do:
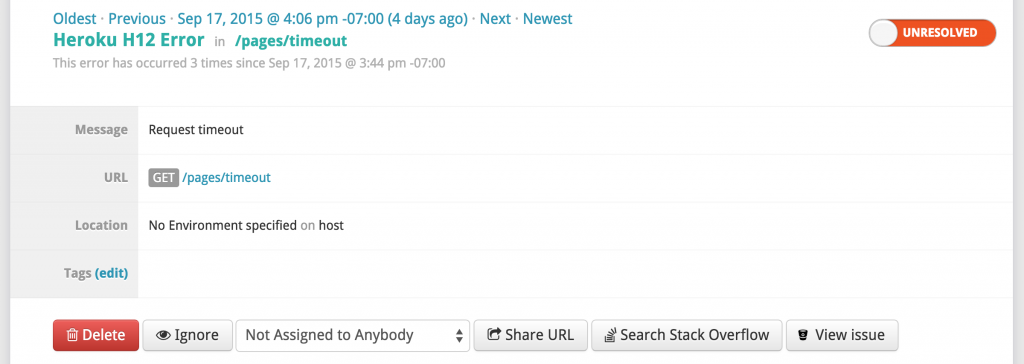
Because this isn't an issue with your code, there is no backtrace; instead we include some other useful data which we can grab from your application logs:
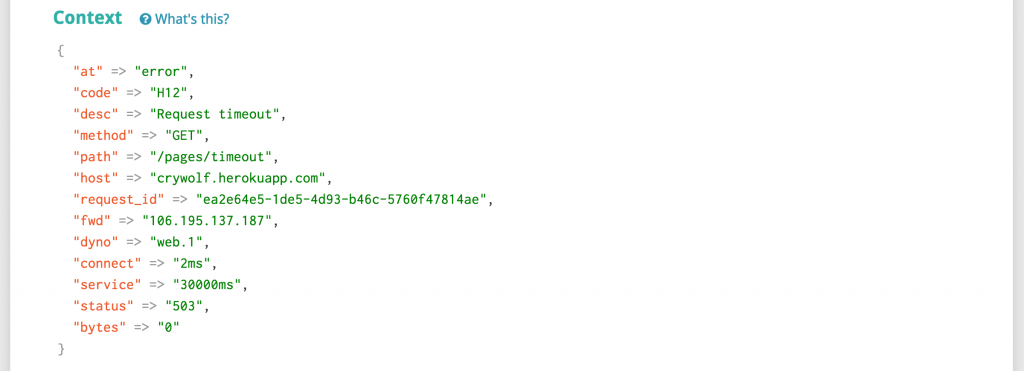 Additional contextual information extracted from the incident log.
If you're on the Small plan or higher, we'll notify all of your existing alerts and integrations when a platform error happens, just like we do for exceptions. Smaller plans can still see platform errors in Honeybadger, however you will need to upgrade if you want alerts.
How to get it
If you aren't a customer yet and add our Heroku addon to your app then you will start seeing platform errors immediately. Existing customers (both of our addon and Honeybadger.io) will need to do some extra setup to start seeing platform errors:
To check whether you need to setup a log drain, run the following command from your command line, replacing APP_NAME with the name of your Heroku app:
heroku drains -a APP_NAME
If you see something like "[ Honeybadger Development ]" (where "Development" is the name of your Honeybadger plan) or any mention of "logplex.honeybadger.io" in the output, then you do not need to install a new log drain. Otherwise, to add the log drain, run the following command, replacing API_KEY with your Honeybadger project's secret token and APP_NAME with the name of your Heroku app:
heroku drains:add https://logplex.honeybadger.io/heroku/v1?api_key=API_KEY -a APP_NAME
Questions/suggestions? I'd love to hear them -- email me!

Written by
Joshua WoodJosh started hacking on IRC scripts in the late nineties and has been hacking on computers (and businesses) ever since. As a co-founder of Honeybadger he works on the product, leads marketing and developer relations, and is involved in many open-source projects.