A comprehensive guide to Fly.io logging
Deployment is not the end of shipping your application. From time to time, you will get errors that you will need to attend to. Without a good method of catching errors or logs in general, you could end up with uncaught issues that might cost you valuable customers in the process.
In this article, you will learn how to catch logs for an application deployed on Fly.io. You will learn how Fly.io logging works, then learn ways to handle logs natively on the platform. Finally, we will see a better way of logging with Honeybadger.
How does Fly.io logging work?
Fly.io runs deployed apps inside a lightweight VM booted from an unpacked image. In each container where the application is running, a process (init) is activated to run and monitor your app. This init program, along with others, collects the application's output from stdout or stderr and redirects it to the host machine.
It is not enough to just collect logs; we still need a way to handle and manage any potential errors or logs. In the host machine, Fly.io uses a socket to send the logs to Vector. The logs are then sent into Fly's internal NATS cluster, where Clients can subscribe to specific topics. In Fly log shipper, Vector acts as a NATS client, reads the logs, and ships them to a Vector Sink (e.g., Honeybadger).
Basic way to access logs on Fly.io
Fly.io makes it easy to access application logs. Since applications running on Fly.io write output to standard output (stdout) and standard error (stderr), Fly.io automatically collects and streams those logs for you.
In this section, you will deploy a sample FastAPI project to Fly.io. The application is intentionally built to generate application logs for the learning process.
Building a FastAPI application that generates logs
To demonstrate logging, we will build a simple API with endpoints that generate different types of log messages.
Create a project directory and move into it:
mkdir flyio-logging-demo
cd flyio-logging-demo
Create a virtual environment and activate it:
python -m venv venv
source venv/bin/activate
Install FastAPI and Uvicorn:
pip install fastapi uvicorn
Create a file named main.py and add the following code:
import logging
from fastapi import FastAPI

app = FastAPI()

logging.basicConfig(
    level=logging.INFO,
    format="%(asctime)s %(levelname)s %(message)s"
)

logger = logging.getLogger(__name__)

@app.get("/")
def home():
    logger.info("User created")
    return {"message": "Hello from Fly.io"}

@app.get("/login")
def login():
    logger.warning("Rate limit approaching")
    return {"message": "Login request received"}

@app.get("/error")
def error():
    logger.error("Database connection failed")
    return {"message": "Error logged"}
The application contains three endpoints:
/generates an informational log/logingenerates a warning log/errorgenerates an error log
Fly.io automatically captures the following logs:
print("Application started")
logger.info("User created")
logger.warning("Rate limit approaching")
logger.error("Database connection failed")
As long as your application writes output to standard output or standard error, Fly.io will collect and surface those logs.
Now you can run your app with the following command:
uvicorn main:app --reload
Open another terminal and send requests to generate logs:
curl http://localhost:8000/ -w "\n" && curl http://localhost:8000/login -w "\n" && curl http://localhost:8000/error -w "\n"
Your terminal should display output similar to:
{"message":"Hello from Fly.io"}
{"message":"Login request received"}
{"message":"Error logged"}
Now that the application is generating logs, we can deploy it to Fly.io.
Containerizing the application
Here we will put the application in a Docker container for easy deployment. Start by creating a file named requirements.txt and adding the following to it:
fastapi
uvicorn
Next, create a file named Dockerfile and copy and paste this into it:
FROM python:3.11-slim

WORKDIR /app

COPY requirements.txt .

RUN pip install --no-cache-dir -r requirements.txt

COPY . .

CMD ["uvicorn", "main:app", "--host", "0.0.0.0", "--port", "8080"]
The Dockerfile installs the application dependencies and starts the FastAPI server.
Creating a Fly.io application
Assuming you already have an account on Fly.io, install Fly.io CLI and log in to Fly.io using the CLI:
fly auth login
Initialize a new Fly application:
fly launch
Fly.io will ask a few questions about your application configuration and then generate a fly.toml file. You can review the generated configuration and accept the defaults for this tutorial.
Now you can deploy your application with the following command:
fly deploy
Fly.io will build the container image and start a Machine running your FastAPI application. After deployment completes, open the application:
fly open
You should see the JSON response:
{
  "message": "Hello from Fly.io"
}
Now generate some logs from the deployed application by sending requests to each endpoint or opening them in the browser.
Each request produces log output that Fly.io collects automatically. You can tail live logs with the fly logs command:
fly logs
You should see output similar to this:
2026-05-31T17:14:42Z app[d89492dc3e5208] cdg [info]2026-05-31 17:14:42,377 INFO User created
2026-05-31T17:14:42Z app[d89492dc3e5208] cdg [info]INFO:     172.16.45.10:59882 - "GET / HTTP/1.1" 200 OK
2026-05-31T17:14:42Z app[d89492dc3e5208] cdg [info]INFO:     172.16.45.10:59894 - "GET /favicon.ico HTTP/1.1" 404 Not Found
2026-05-31T17:16:57Z app[d89492dc3e5208] cdg [info]2026-05-31 17:16:57,535 ERROR Database connection failed
2026-05-31T17:16:57Z app[d89492dc3e5208] cdg [info]INFO:     172.16.45.10:52308 - "GET /error HTTP/1.1" 200 OK
2026-05-31T17:17:23Z app[d89492dc3e5208] cdg [info]2026-05-31 17:17:23,565 WARNING Rate limit approaching
2026-05-31T17:17:23Z app[d89492dc3e5208] cdg [info]INFO:     172.16.45.10:39662 - "GET /login HTTP/1.1" 200 OK
These logs are streamed in real time. To test this, leave the command running and make additional requests to the API. New log entries will appear immediately.
While this is one way to keep an eye on your logs, this method is not really efficient when monitoring application issues during deployment because it requires you to watch your logs at all times. But it can sometimes be useful for debugging.
If you work with multiple Fly applications, specify the application name:
fly logs -a my-fastapi-app
This ensures you only receive logs from the application you are interested in.
Applications can run on multiple machines. You can see a list of your Machines:
fly machine list
You can inspect a Machine using the Machine ID:
fly machine status d89492dc3e5208
This is useful when troubleshooting issues affecting only a single Machine instance.
Viewing logs from the Fly.io dashboard
Fly.io also provides live tail logs through its web dashboard.
Open your application in the Fly.io dashboard and navigate to the Logs section. Here you will see a view of your application's log stream, which can be convenient when you are away from your terminal or reviewing recent activity.
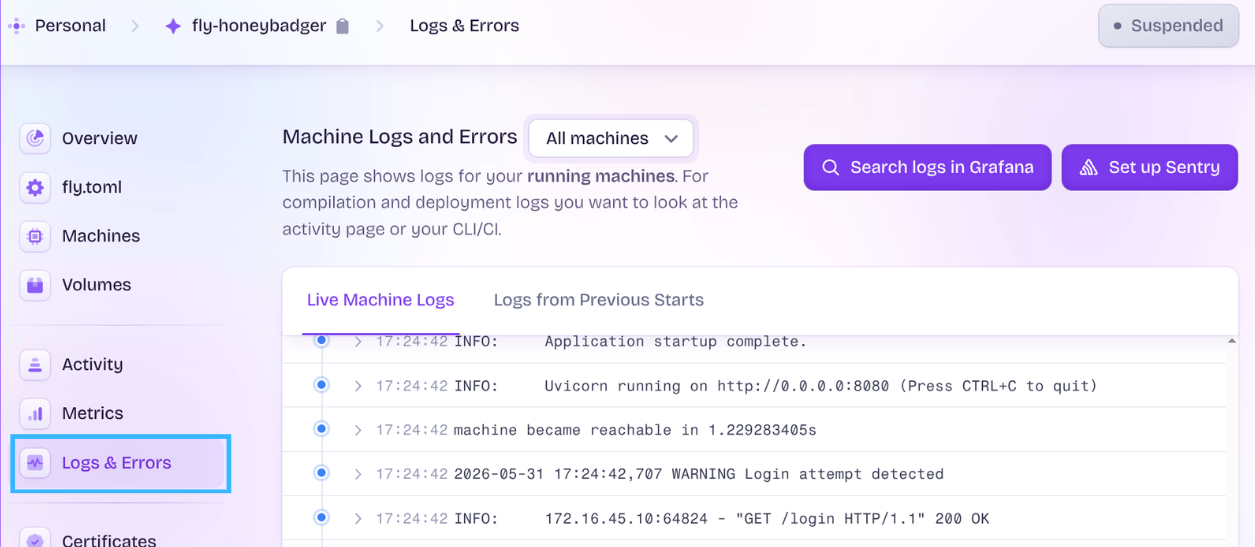
For simple debugging tasks, the fly logs command is the quickest way to inspect application activity. As your applications grow, log management becomes an important part of understanding application behavior and monitoring the health of your services, and tools like Honeybadger Insights help manage them effectively.
Shipping Fly.io logs to Honeybadger Insights
As mentioned earlier, Vector acts as a NATS client, and this is the basis of the Fly log shipper. Vector grabs the log and sends it to a location of your choosing. In this section, you will learn how to ship your Fly.io logs to Honeybadger Insights using the Fly log shipper.
To get started, we first need to create a new app for Fly log shipper. Run the following command to create a new directory and navigate into that directory:
mkdir logshipper
cd logshipper
Now you can create the log shipper app in the directory you just created:
fly launch --no-deploy --image ghcr.io/superfly/fly-log-shipper:latest
We are adding the --no-deploy so it just creates and configures the app and does not deploy it, since we need to add a few configurations before deployment. --image specifies the prebuilt image to be configured and later deployed.
Now we will set some secrets. Create a new project on Honeybadger and get the API key from that project. Setting HONEYBADGER_API_KEY enables the shipping of logs to your Honeybadger project.
fly secrets set ORG=personal # The org you chose when running "fly launch"
fly secrets set ACCESS_TOKEN=$(fly auth token) # gets and sets Fly token
fly secrets set HONEYBADGER_API_KEY=PROJECT_API_KEY
Keeping your Fly tokens in secrets rather than hard-coding them helps protect access to your Fly.io infrastructure.
Edit the generated fly.toml file, replacing the entire [http_service] section with this:
[[services]]
  http_checks = []
  internal_port = 8686
You can now deploy the logger application:
fly deploy
Once that's done, you should see logs from your apps flowing into Insights. When you send requests to your deployed app, you will see the activity logged on to Honeybadger Insights.
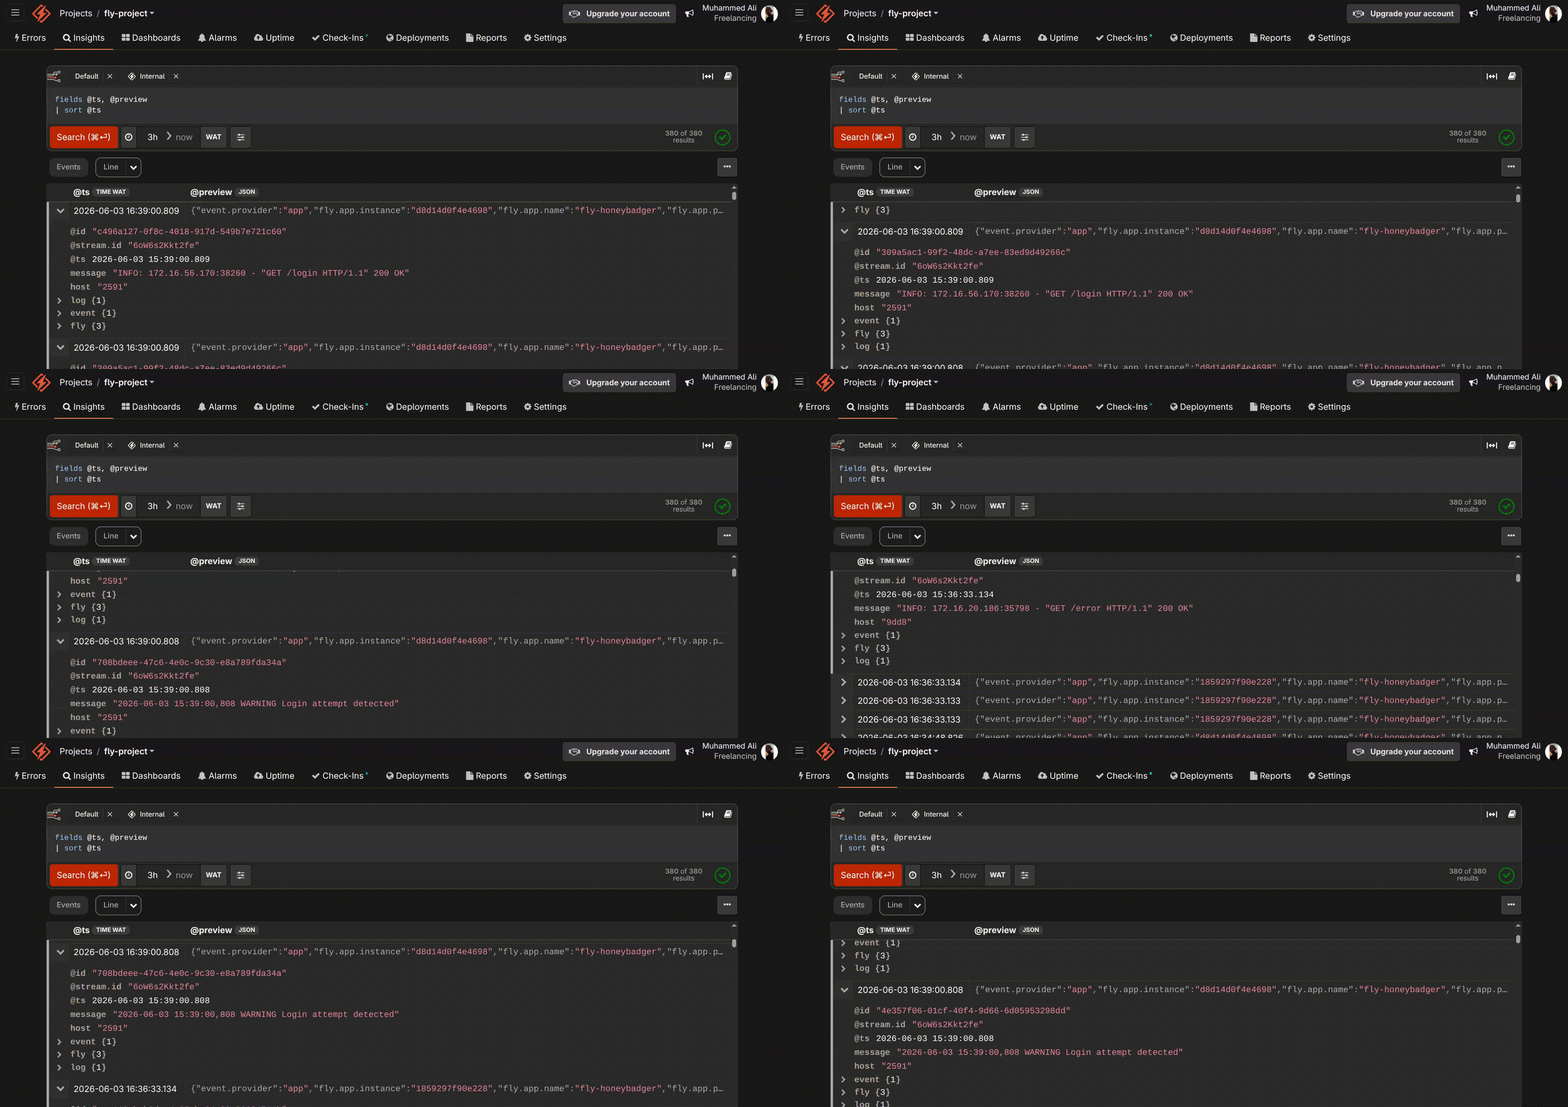
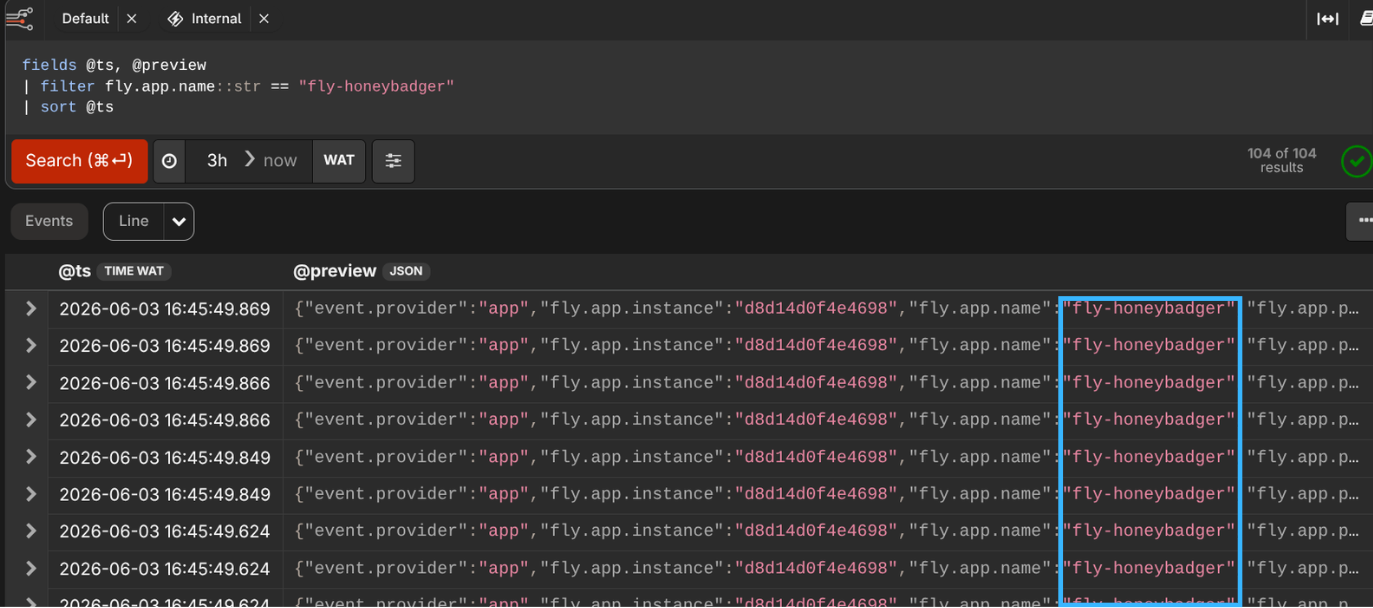
On Honeybadger, you can run many queries on these logs, including searches like this:
fields @ts, @preview
| filter fly.app.name::str == "fly-honeybadger"
| sort @ts
In this query, we’ve piped the initial results (fields @ts, @preview) through filter, which accepts a variety of conditions. Here we have specified the data type of the fly.app.name field as str and compare to the string provided ("fly-honeybadger").
Basically, this is going through your logs and selecting the apps on Fly.io with the name “fly-honeybadger”. This can be helpful when you have multiple applications deployed on Fly.io.
More on Honeybadger Insights
In this article, you saw how Fly.io captures everything your application writes to stdout and stderr, and how Fly's internal architecture (Vector → NATS → log shipper) makes it straightforward to route logs to external destinations. We then saw how to use Insights as a more well-rounded solution for logging.
We only went through a surface level of what Insights is capable of when it comes to Fly.io logging, establishing a foundation for the deeper view into data analytics that Honeybadger enables. Having all that data available in one place reduces the time it takes to find answers, enabling you to easily:
- Query and filter Fly.io logs using Honeybadger's powerful search language.
- Correlate logs with application errors or other application metrics.
- Monitor application behavior across multiple Fly.io deployments.
- Analyze your logs.
If you are already using Fly.io in production, this article demonstrated one of the simplest ways to move from basic log viewing to a complete observability workflow with no additional code needed.
Now that you know everything you need to about Fly.io logging, sign up for a free Honeybadger account and start shipping your Fly.io logs today.

Written by
Muhammed AliMuhammed is a Software Developer with a passion for technical writing and open source contribution. His areas of expertise are full-stack web development and DevOps.