Honeybadger year in review: What we shipped in 2025
Happy holidays! 2025 has been a busy and productive time here at 'Badger HQ. While we shipped a lot of cool things, four features really stand out as we look back on the year. Our top features in 2025 include:
- Smart APM dashboards that adapt to your stack
- Insights Alarms: Get real-time alerts from your metrics and logs
- EU data residency: Store your sensitive customer data in the EU
- Honeybadger MCP server (for your AI assistants) and other integrations
We also attended some conferences this year! MicroConf, RailsConf, Laracon, ElixirConf, Rocky Mountain Ruby, and SF Ruby:

It was great connecting with so many folks in person, discussing application monitoring, and sharing some delicious meals.
Smart dashboards that adapt to your stack
Most APMs somehow manage to be both too much and too little, overwhelming you with dashboards and data while failing to answer the questions that matter when production breaks. Meanwhile, the things you actually care about—such as signups, payment failures, and that one background job that keeps timing out—require complex custom instrumentation. That's backwards.
We made it easier to build custom APM dashboards that adapt to your workflow. Start with smart defaults for your stack, then customize everything to track what matters most to your product and business.
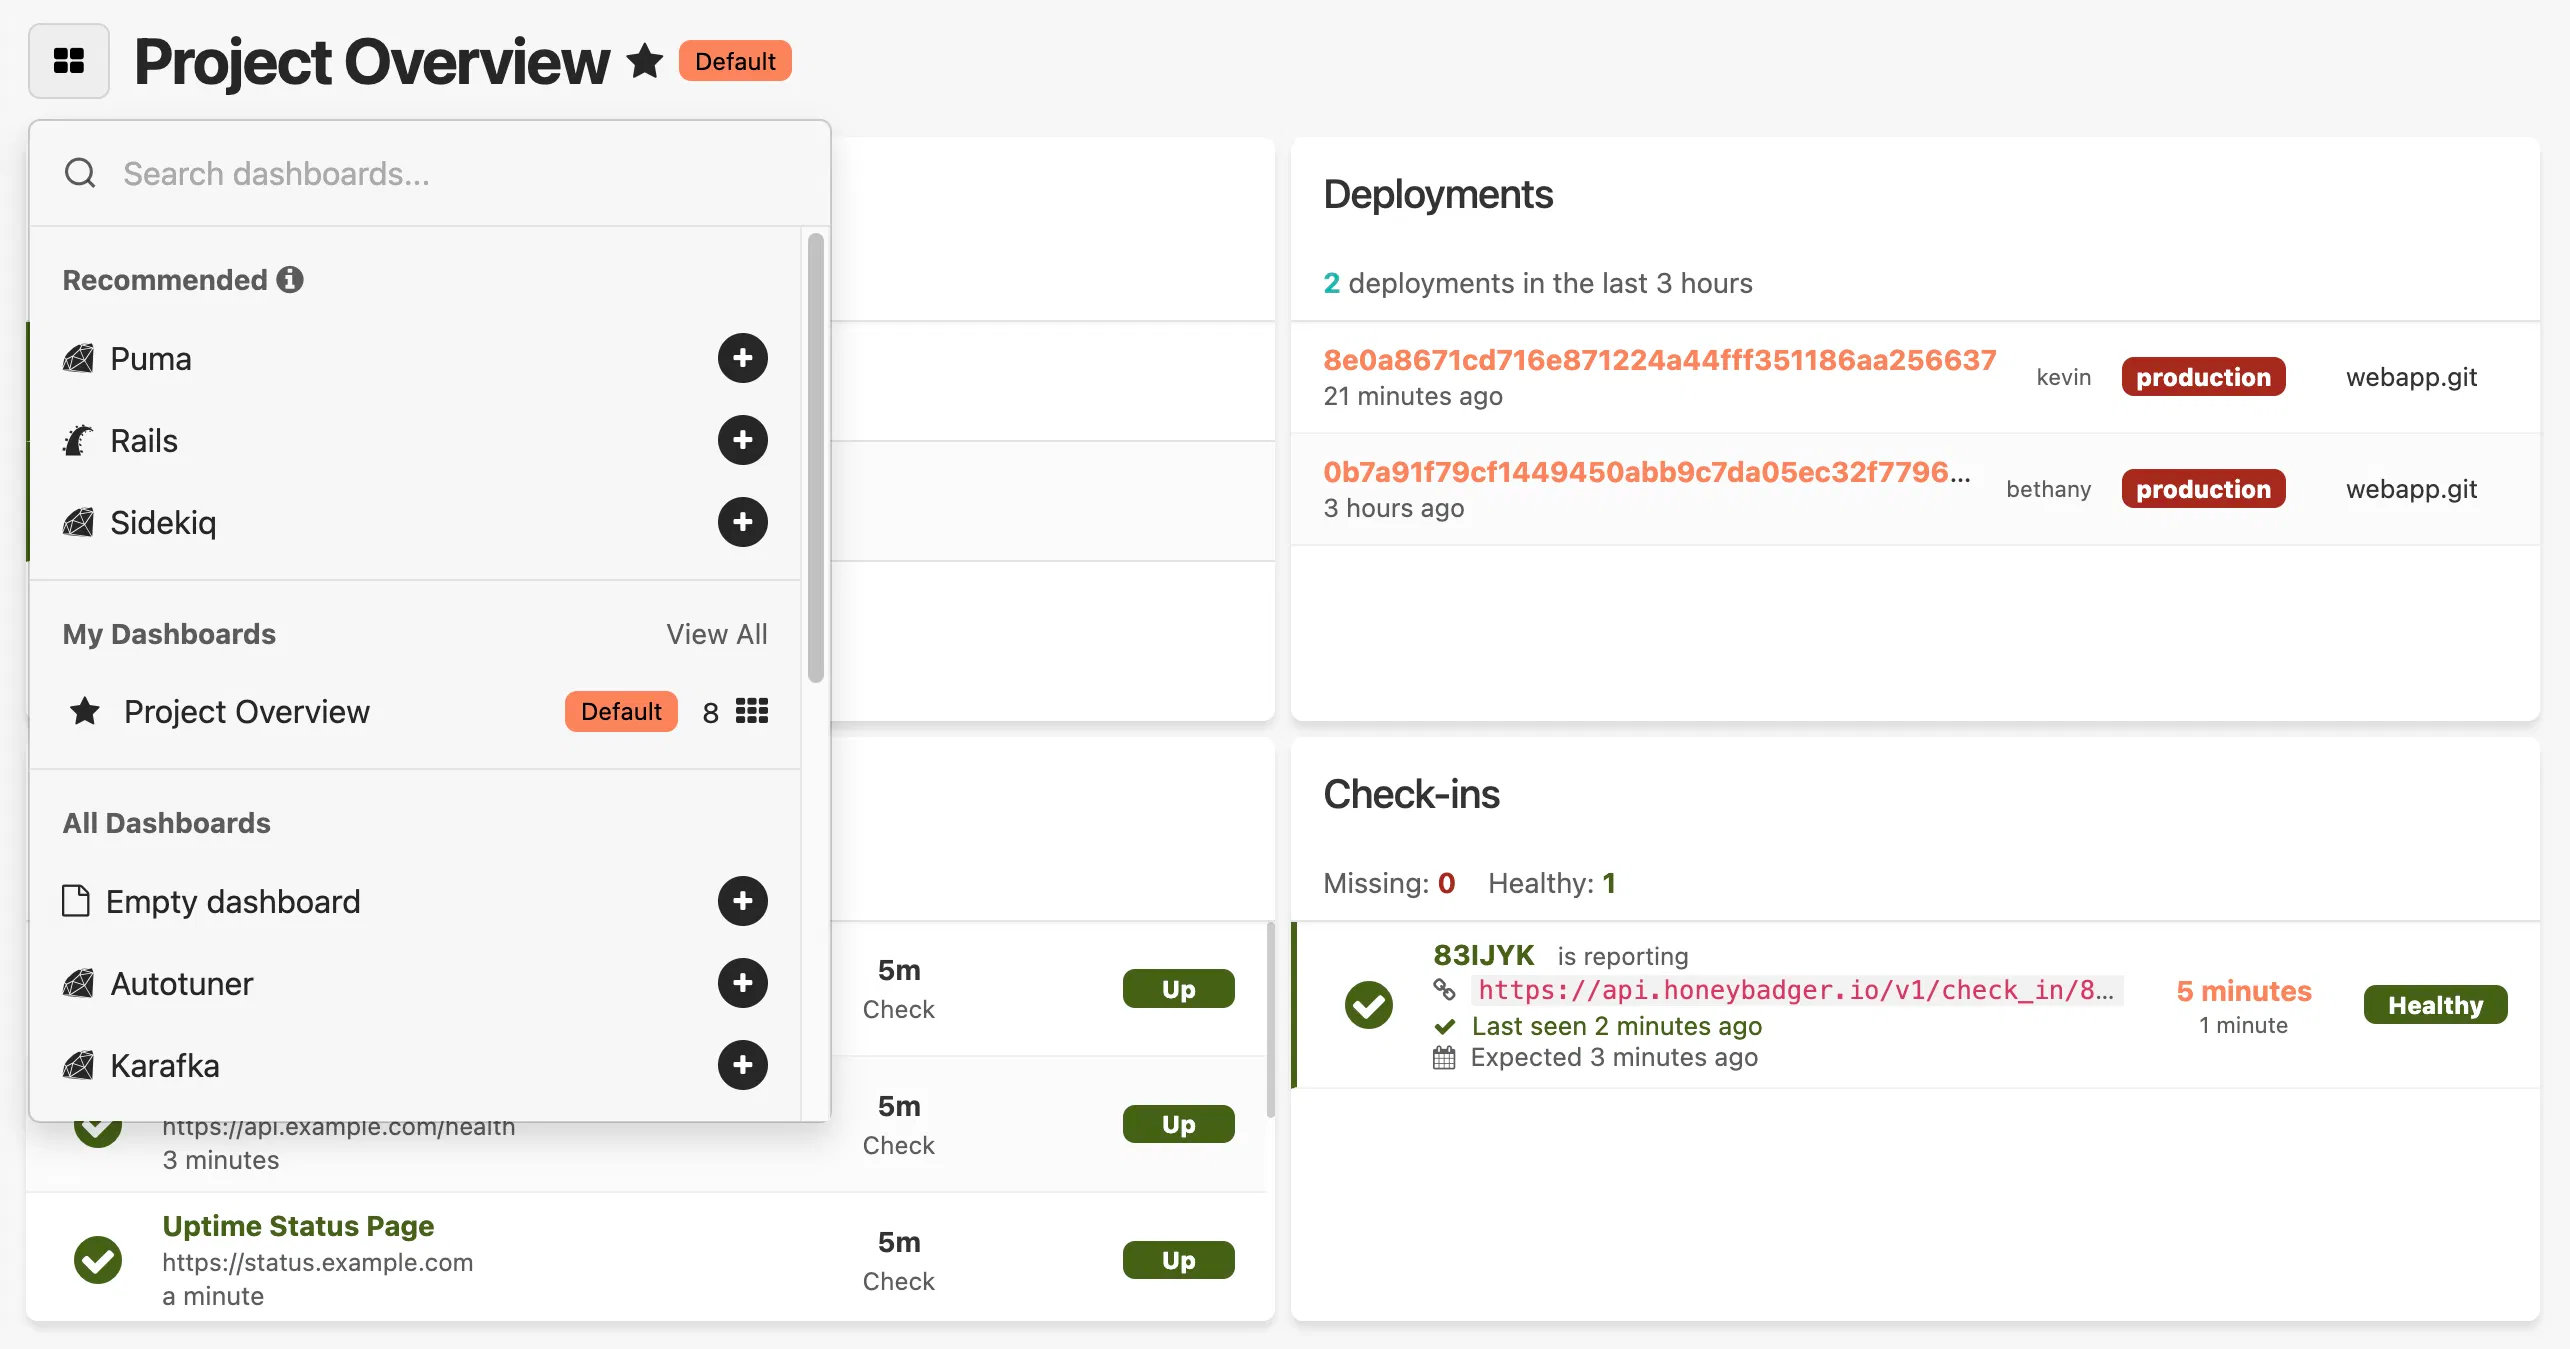
In addition to a new intelligent project overview dashboard (with some major UX improvements!), we’ve now shipped automatic performance monitoring dashboards for Elixir, Python, PHP, and Ruby (including a new dashboard for Sidekiq).
Real-time alerts from your application metrics and logs
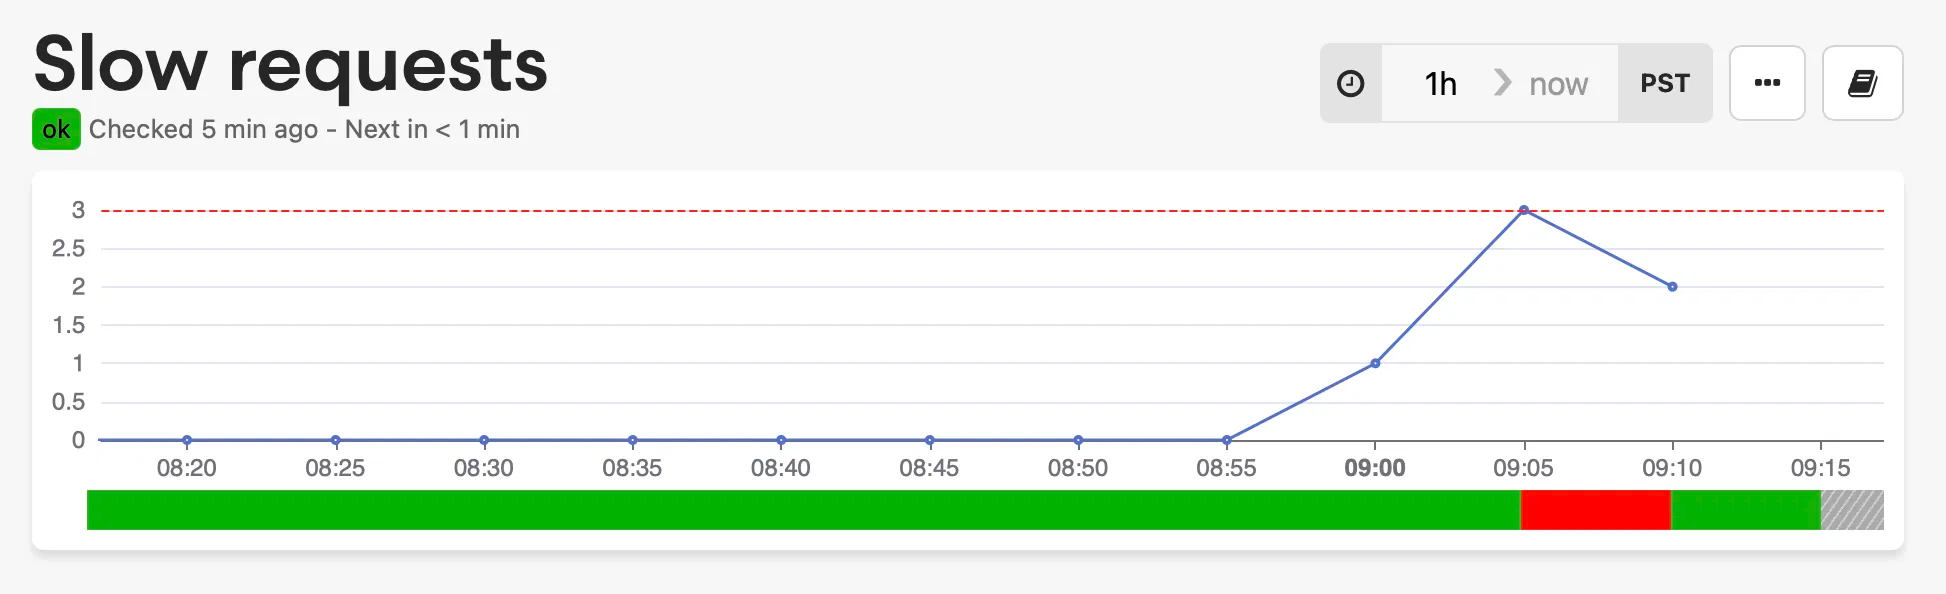
Dashboards are great during an incident or when debugging an issue, but you need to know when to look at them. That's why we built Insights Alarms—now Honeybadger can monitor your logs and metrics in real time and notify you when your systems are misbehaving.
Alarms bridge the gap between data and action, transforming any query into an actionable alert that notifies your team. Honeybadger Insights gives you granular control over monitoring without deploying new instrumentation; write a query, set a threshold, and stay ahead of issues before they impact users.
You can send alerts to Slack, PagerDuty, or any of Honeybadger’s many 3rd-party integrations—giving you incredible flexibility when notifying your team and choosing when and how to respond.
EU data residency 🇪🇺
If your company has EU data residency requirements, you can now use all of Honeybadger's powerful application performance monitoring tools with the peace of mind that your customer data resides in the European Union.
We launched a new dedicated EU Honeybadger region that allows customers to store their application performance monitoring and error tracking data entirely within the EU. This service operates from AWS's eu-central-1 region in Frankfurt, Germany, and is available at eu-app.honeybadger.io.
Connect your AI code assistant directly to Honeybadger to fix errors and more
Debugging errors is faster when your AI assistant has full context about what's happening in your application. We released honeybadger-mcp-server, a new Model Context Protocol (MCP) server that provides AI tools—such as Claude, Cursor, and Copilot—with direct access to your Honeybadger error data and project information.
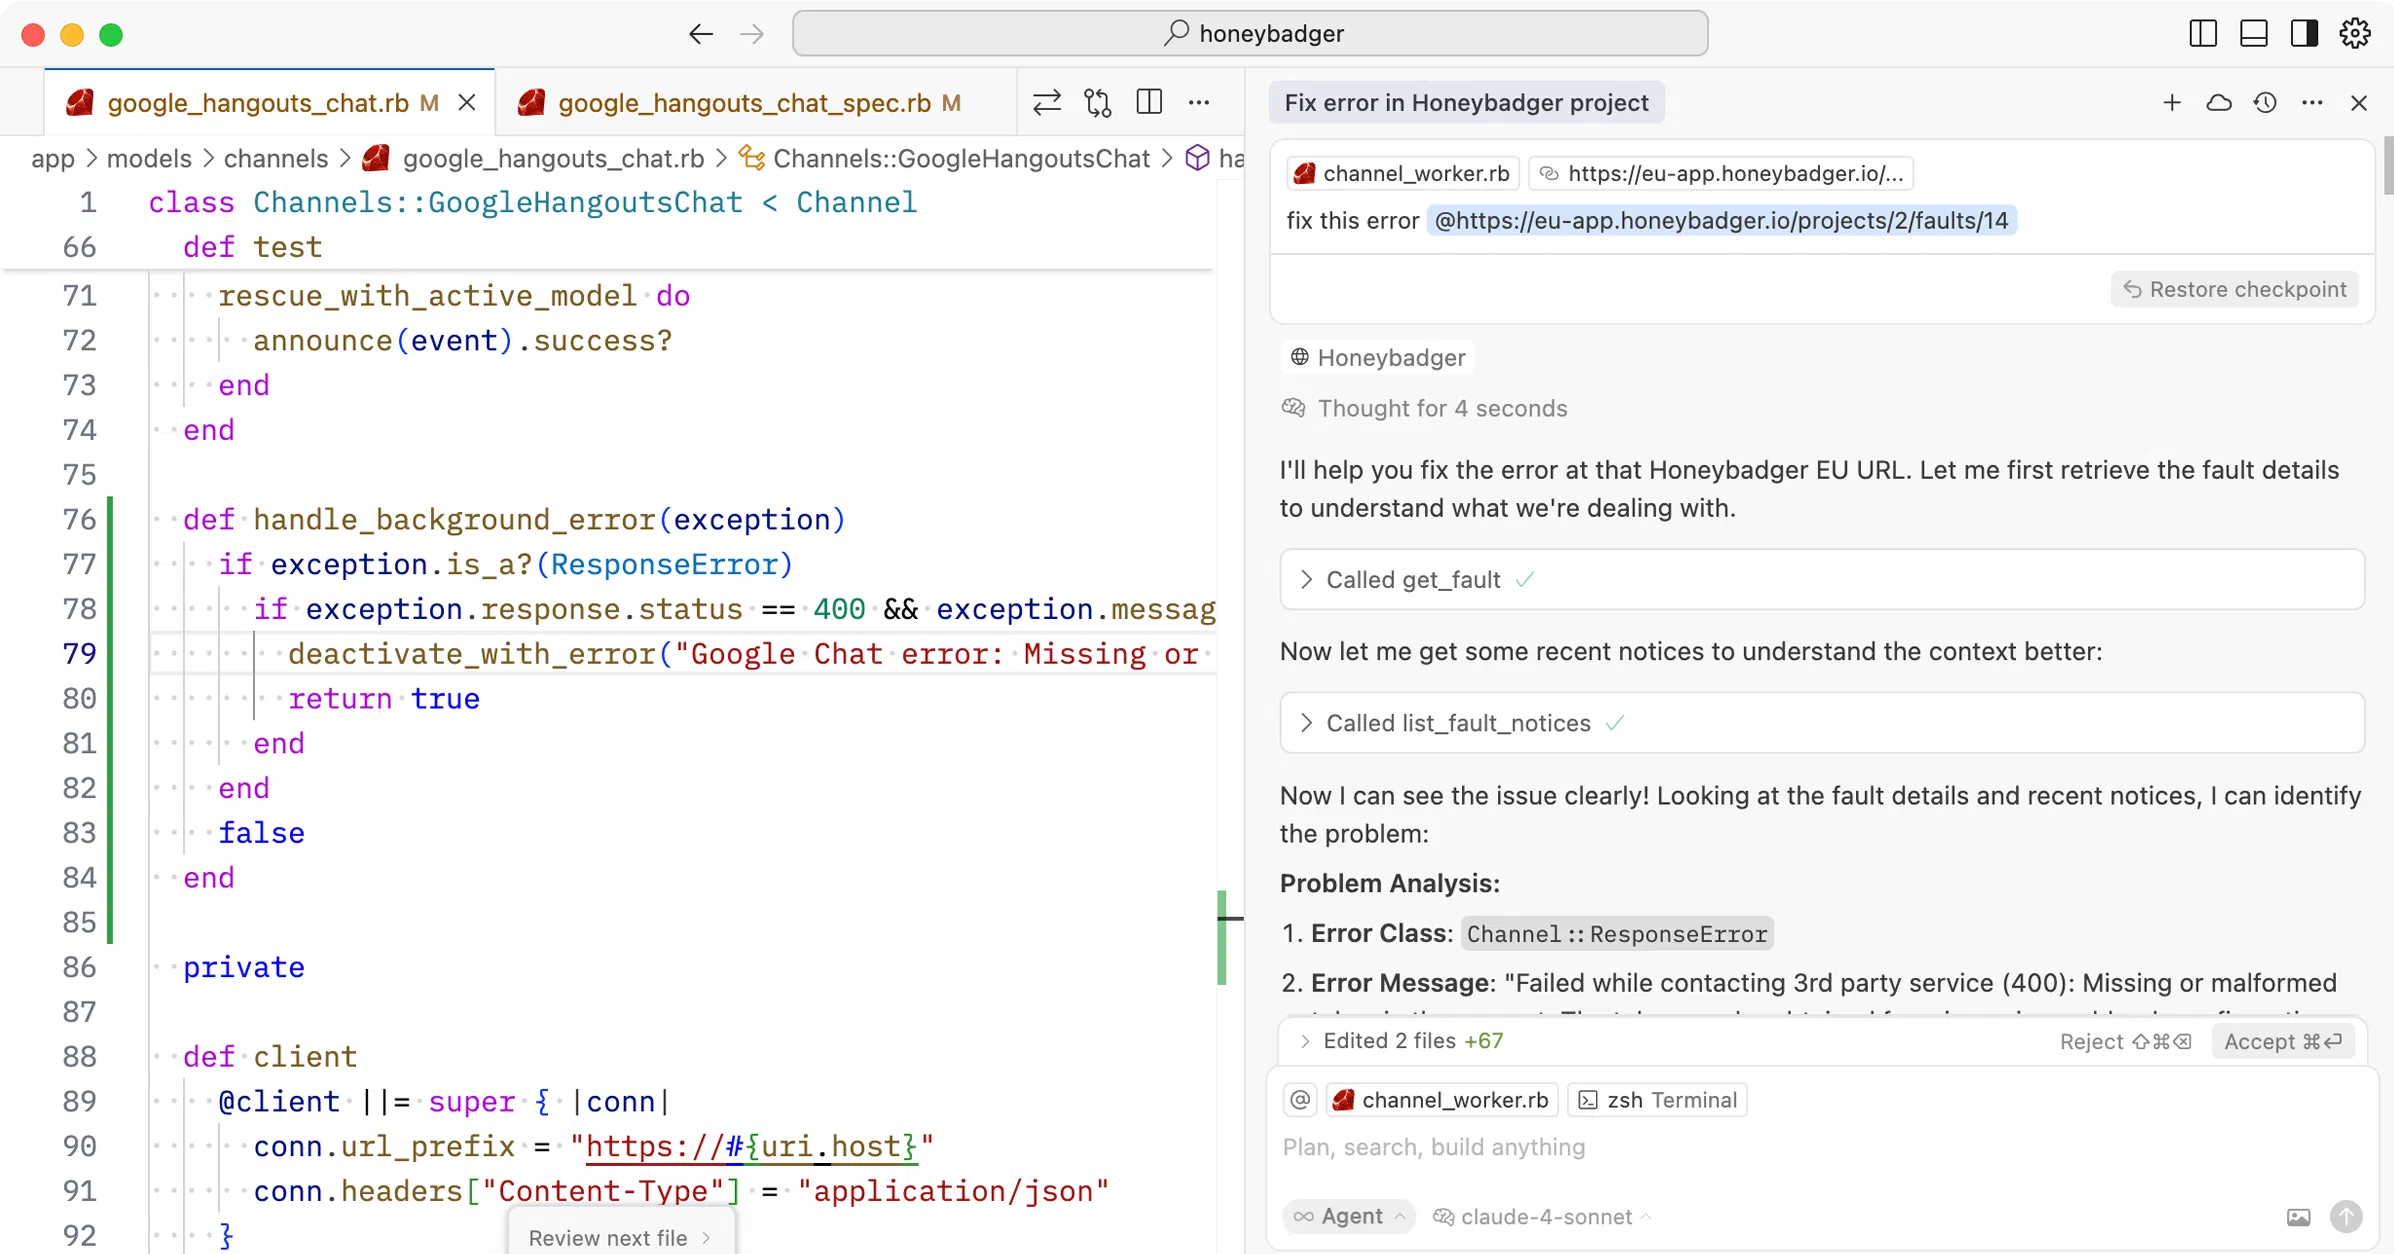
See the Honeybadger docs to learn more about working with LLMs.
New integrations and more
We also added a bunch of new integrations and made other improvements to Honeybadger. Here are some of our favorites:
- Navigate directly to errors from Insights query results
- Export error data as a markdown file
- Require multi-factor authentication for your team
- Customizable timeouts for uptime checks
- AI-ready backtraces in Slack error notifications
- Link existing Linear issues to Honeybadger
- Open files in Cursor, Windsurf, and Zed
- Get Honeybadger alerts in Zulip team chat
- Sync Honeybadger alerts with incident.io
- Automate Rootly incidents from Honeybadger events
- Send Honeybadger alerts to Click-Up chat channels
- .NET and C# error tracking
Get free monitoring when you share Honeybadger
Last but not least, we launched a new customer referral program. If you love Honeybadger, this is a great way to help us out and earn some free monitoring for yourself.
See the docs to learn how to get started. You could knock a nice chunk off your monitoring bill.
That’s all from us! We’ll see you next year—we already have some great plans on our roadmap for 2026.
Until then, happy holidays and happy coding. 🧡

Written by
Joshua WoodJosh started hacking on IRC scripts in the late nineties and has been hacking on computers (and businesses) ever since. As a co-founder of Honeybadger he works on the product, leads marketing and developer relations, and is involved in many open-source projects.