Python performance monitoring for Django, Flask, and Celery
Honeybadger now offers automatic performance dashboards for Django, Flask, and Celery applications. Just like our Ruby, PHP, and Elixir dashboards, HB's Python performance dashboards provide instant visibility into your Python apps with zero-configuration instrumentation, plus direct access to transform, query, and alert on the underlying data.
Our Python performance monitoring builds on Honeybadger Insights to automatically capture telemetry from your applications, then presents it through curated dashboards that highlight performance trends and bottlenecks.
What's new
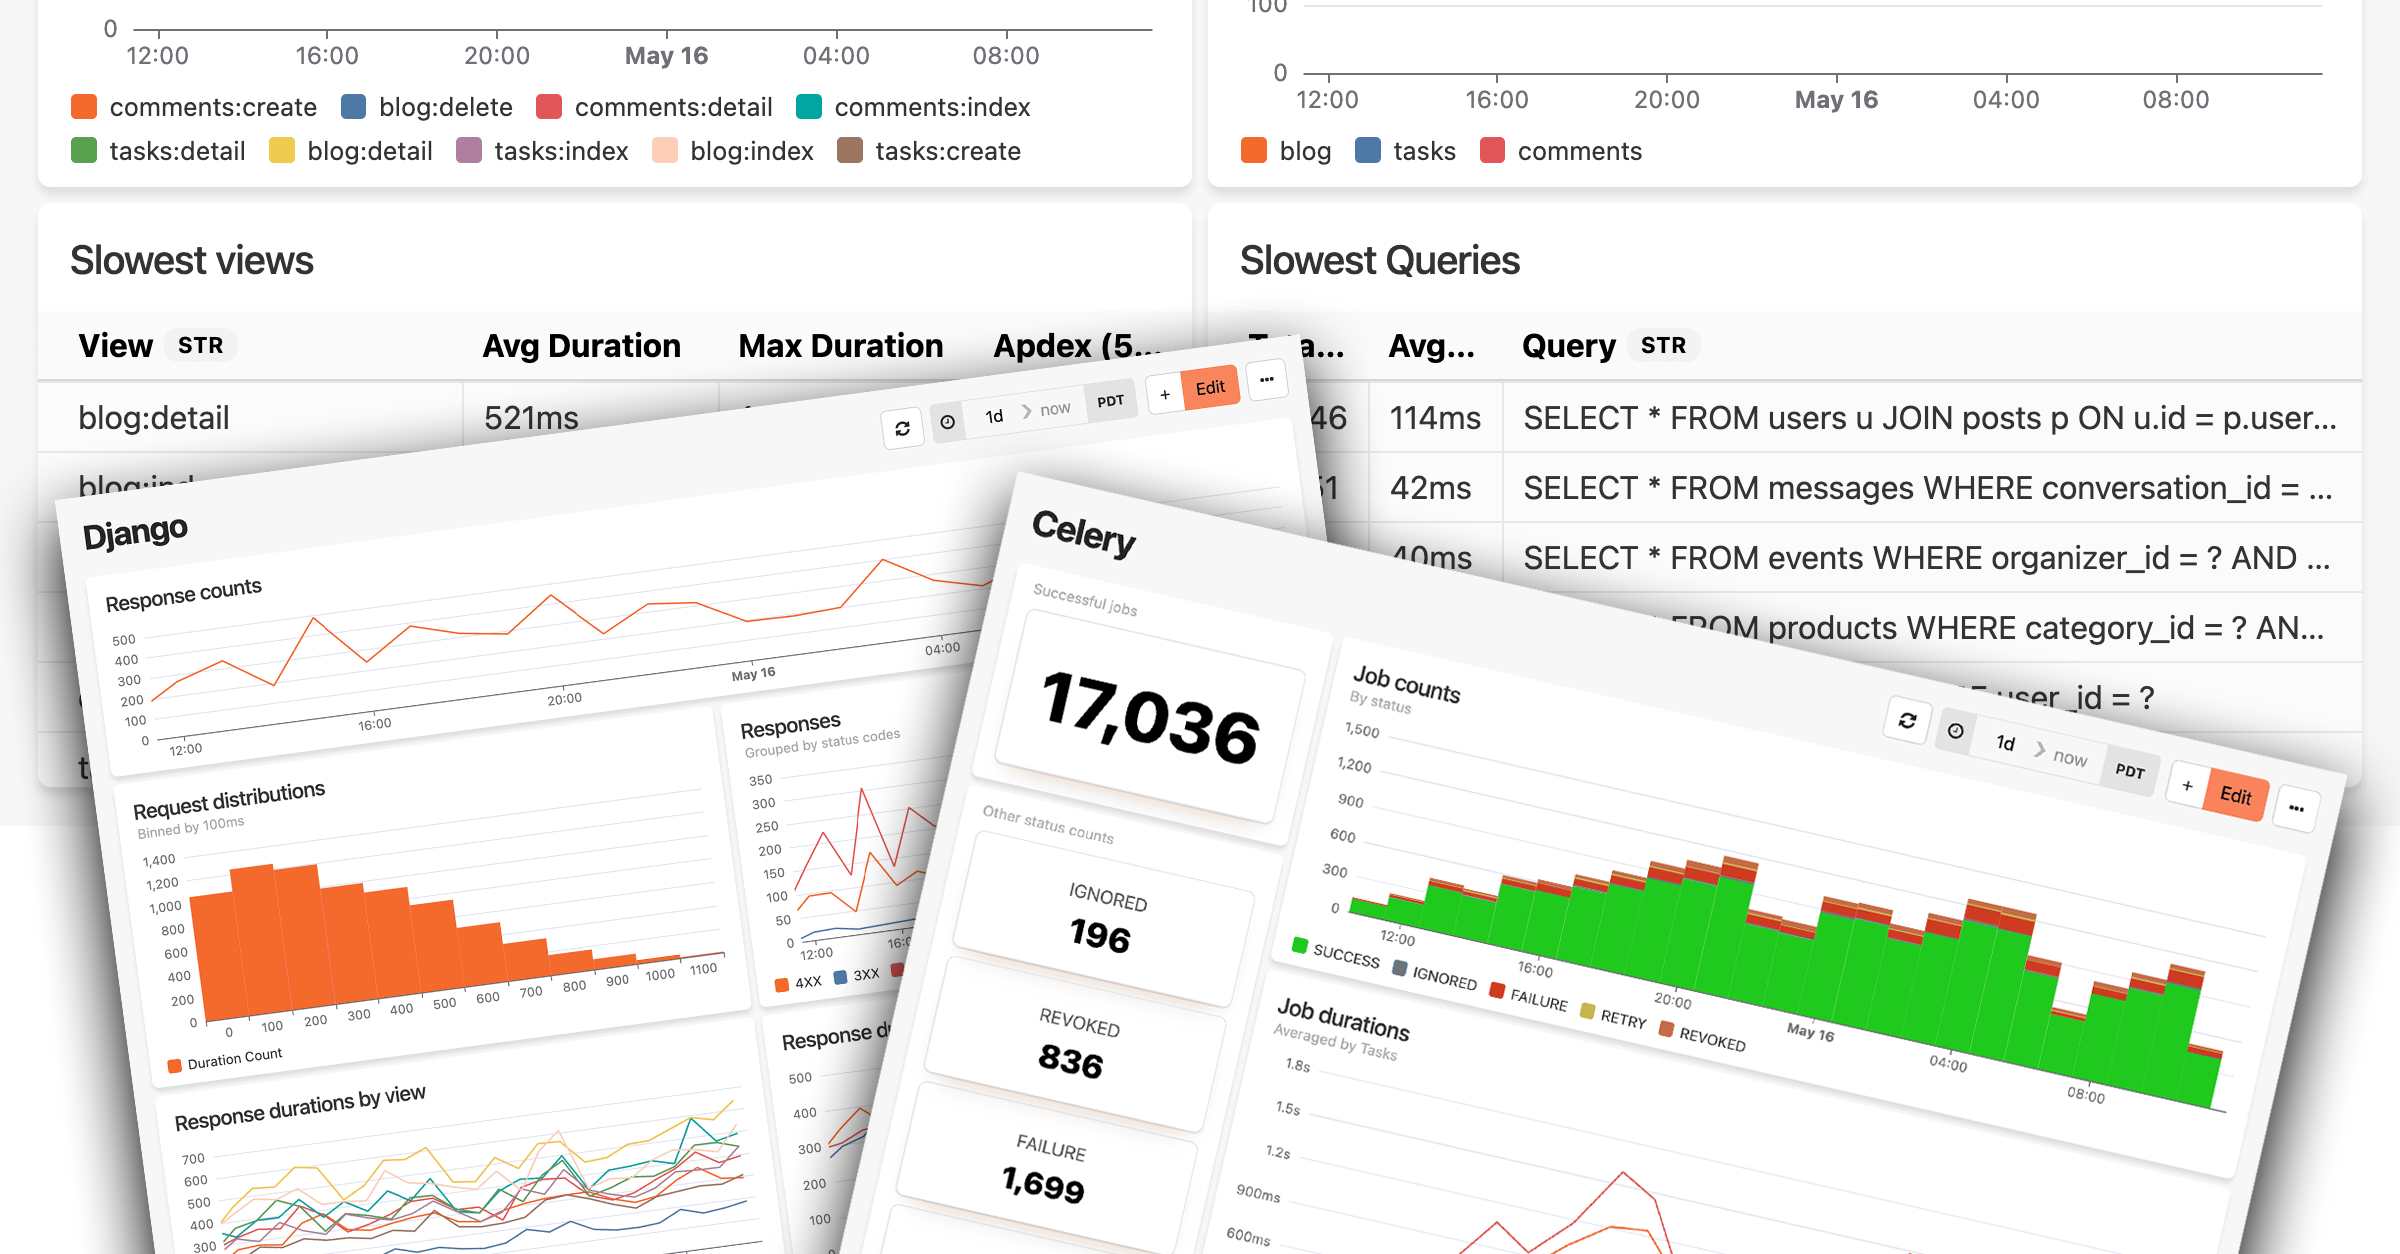
- Django performance dashboard: Track request performance, identify slow views, monitor Django ORM queries, and analyze response distributions—all automatically instrumented from your Django applications.
- Flask performance dashboard: Monitor routes and blueprints, track SQLAlchemy query performance, and get detailed insights into endpoint response times.
- Celery performance dashboard: Visualize background job health, track task execution times, identify slow workers, and monitor job success rates across your Celery queues.
- Zero-config instrumentation: Once you install Honeybadger in your app, the Python package automatically captures telemetry from Django, Flask, FastAPI, and Celery.
How it works
Honeybadger automatically instruments popular Python frameworks to capture detailed performance events, including HTTP requests, database queries, and background job metrics. This telemetry feeds directly into your dashboards, but you also query and analyze the raw data using BadgerQL—and even create alerts for specific events and metrics.
Getting started
If you already use Honeybadger, all you need to do is upgrade your Honeybadger Python package and enable Insights in your config. For new setup instructions, see our integration guides for Django, Flask, and other Python frameworks.
Python performance monitoring is now available for all Honeybadger accounts, with flexible usage-based pricing options. Check out the announcement blog post to learn more and see the dashboards in action.
Try Honeybadger for FREE
Honeybadger is full-stack application monitoring that helps developers move fast and fix things. Get set up in minutes and check monitoring off your to-do list.
Easy 5-minute setup — No credit card required