Smart dashboards that adapt to your stack
Traditional APM tools bury you in dashboards you'll never use. Meanwhile, the things you actually care about—such as signups, payment failures, and that one background job that keeps timing out—require complex custom instrumentation. That's backwards.
We're making it easier to build custom dashboards that adapt to your workflow. Start with smart defaults for your stack, then customize everything to track what matters most to your product and business.
The Project Overview dashboard
We added an intelligent overview dashboard to every project that we configure automatically based on your stack. Are you using Rails? You'll see Rails-specific performance metrics, including slow controller actions, queries, and response codes. Running Phoenix? Get Ecto query performance and LiveView metrics. It's a great way to get a high-level view of your project, including errors, performance, uptime checks, and more.
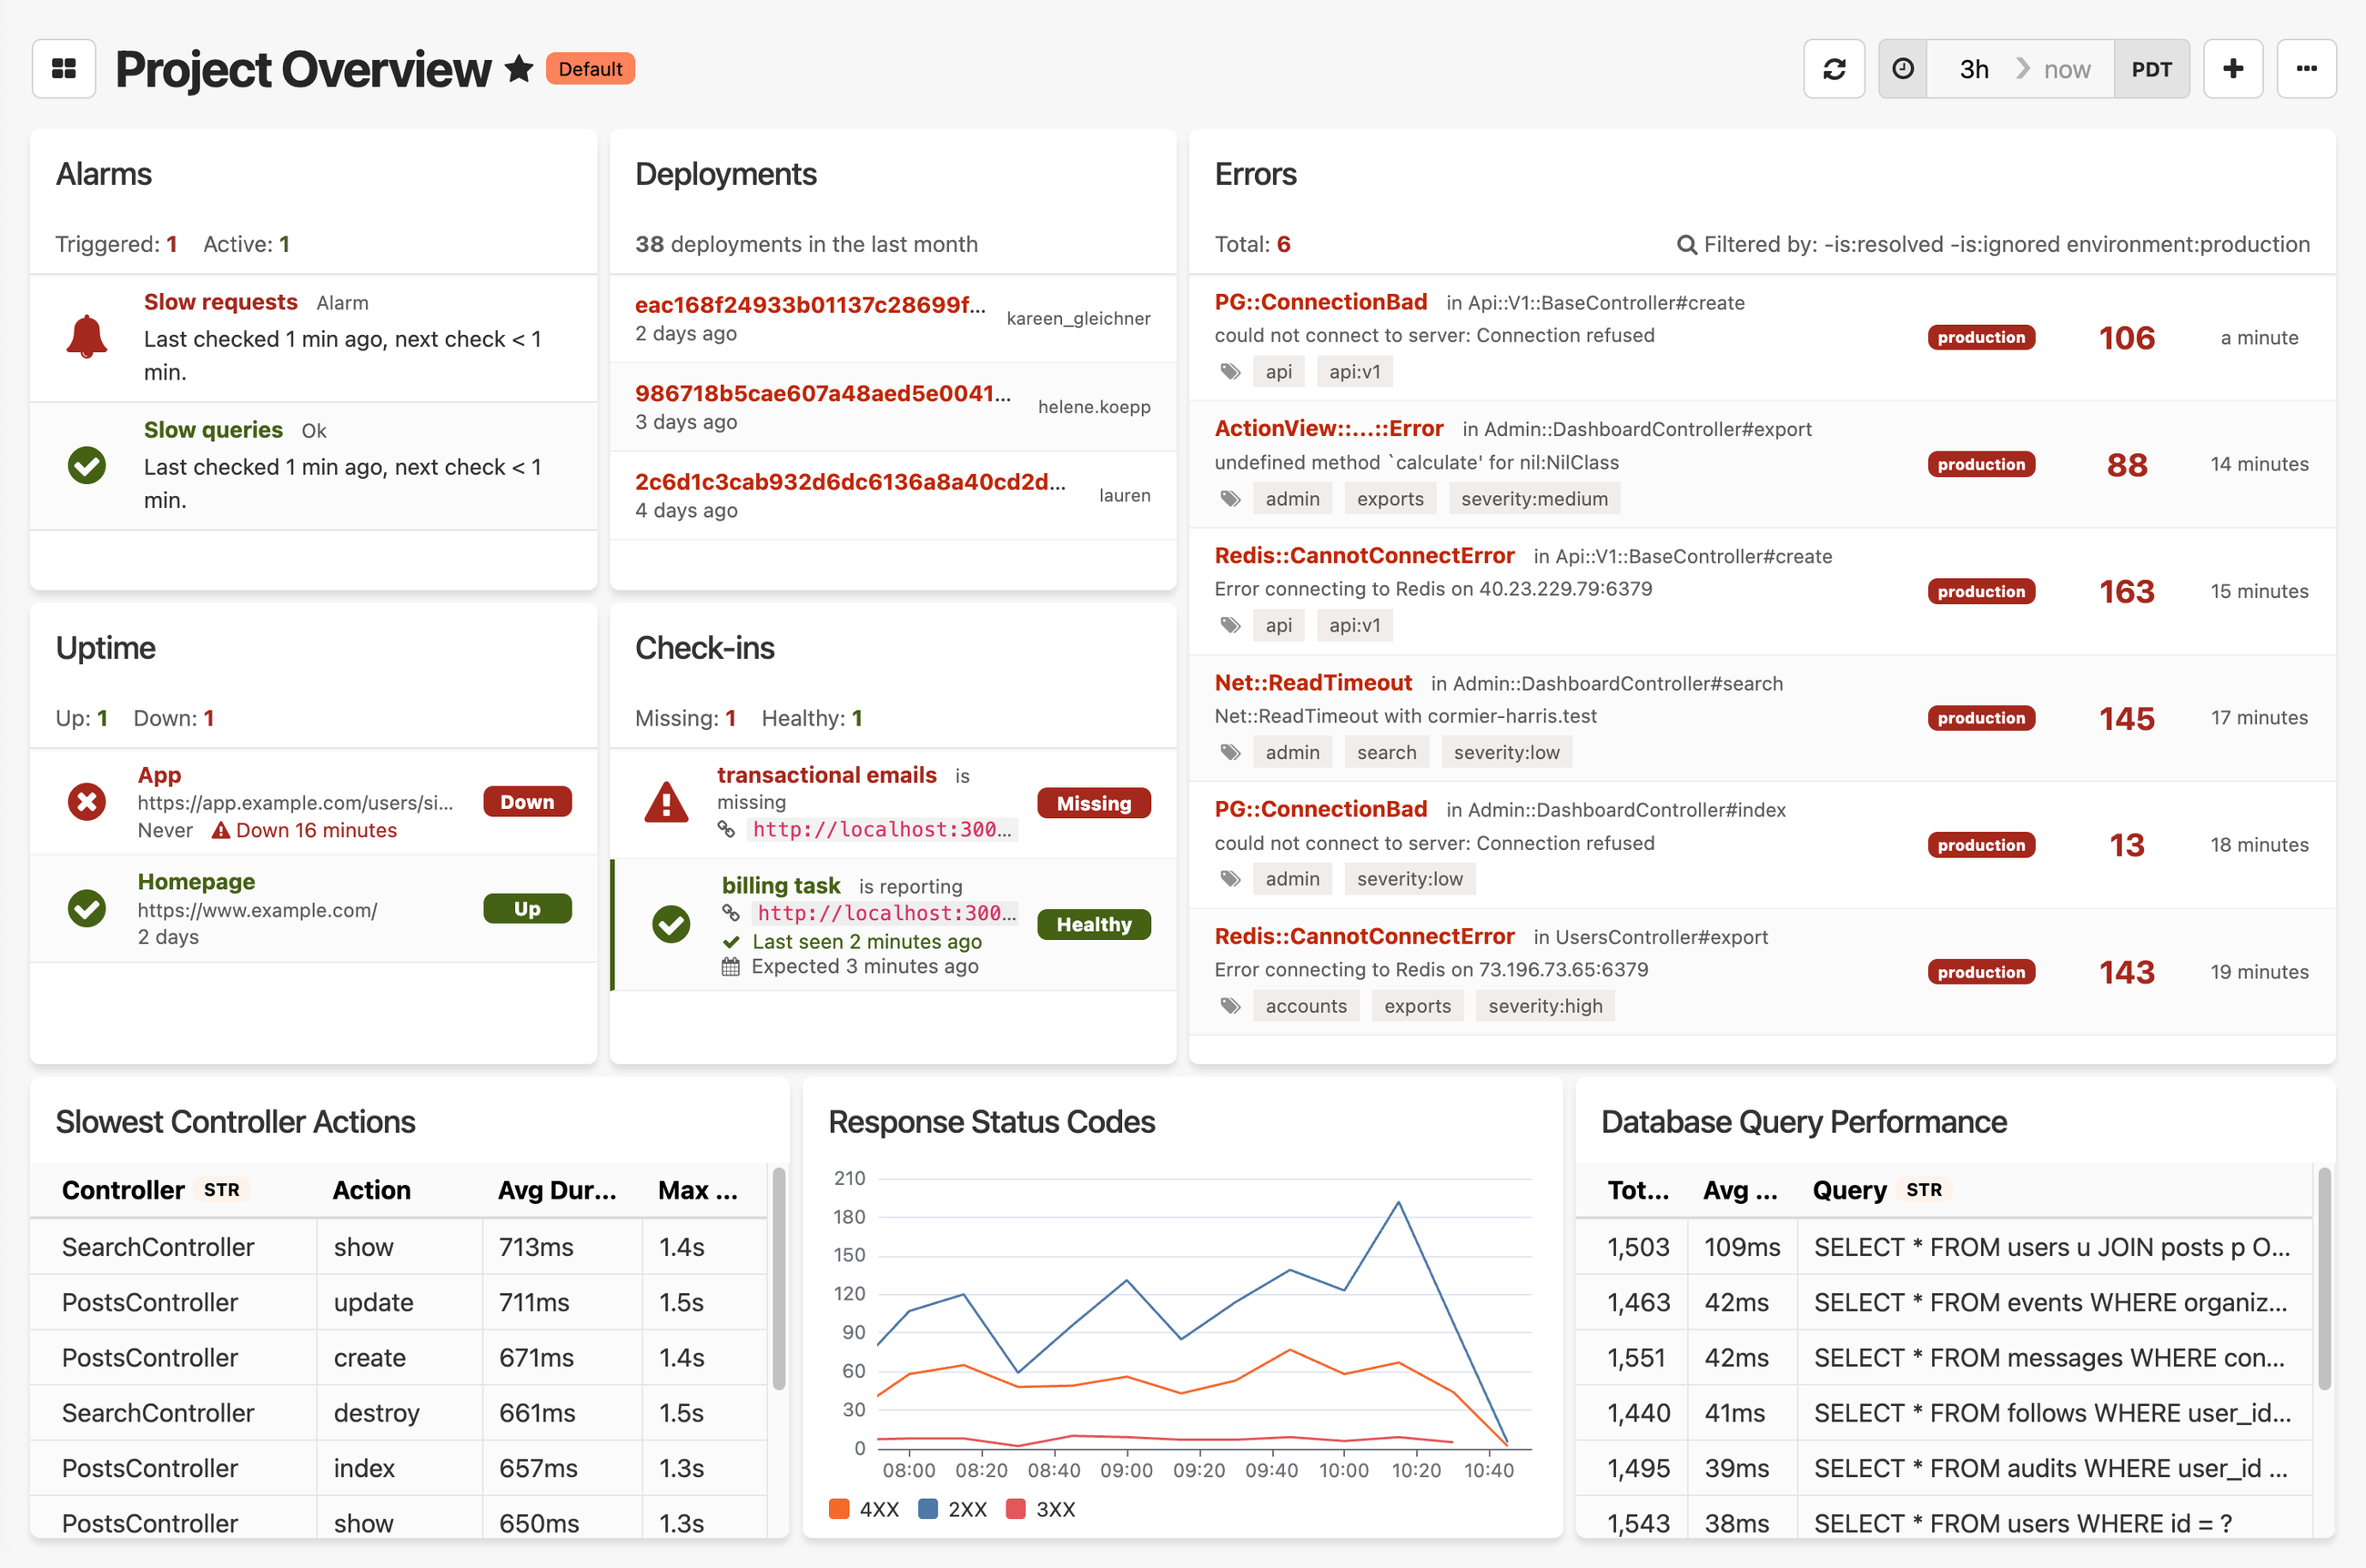
Honeybadger's new default Project Overview dashboard
To tie it all together, we added five new Honeybadger-specific widgets to give you quick access to:
- Errors: List your latest error reports with configurable search filters
- Uptime checks: See the status of your active uptime checks
- Check-ins: See when your cron jobs and scheduled tasks last checked in
- Deployments: List your latest app deployments
- Alarms: See your custom alerts from Honeybadger Insights
These widgets appear on the default project overview dashboard by default, but they're also available in the new widget library to add to your other dashboards a la carte.
Fast dashboard switching with recommended dashboards
You can now quickly switch between your dashboards and discover new ones with a new dropdown menu that recommends automatic dashboards for your application. If you're using Sidekiq in Ruby or Oban in Elixir, for example, you can add those dashboards to your project with one click. We currently have automatic dashboards for popular tools and frameworks in Ruby, PHP, Elixir, and Python, with more on the way.
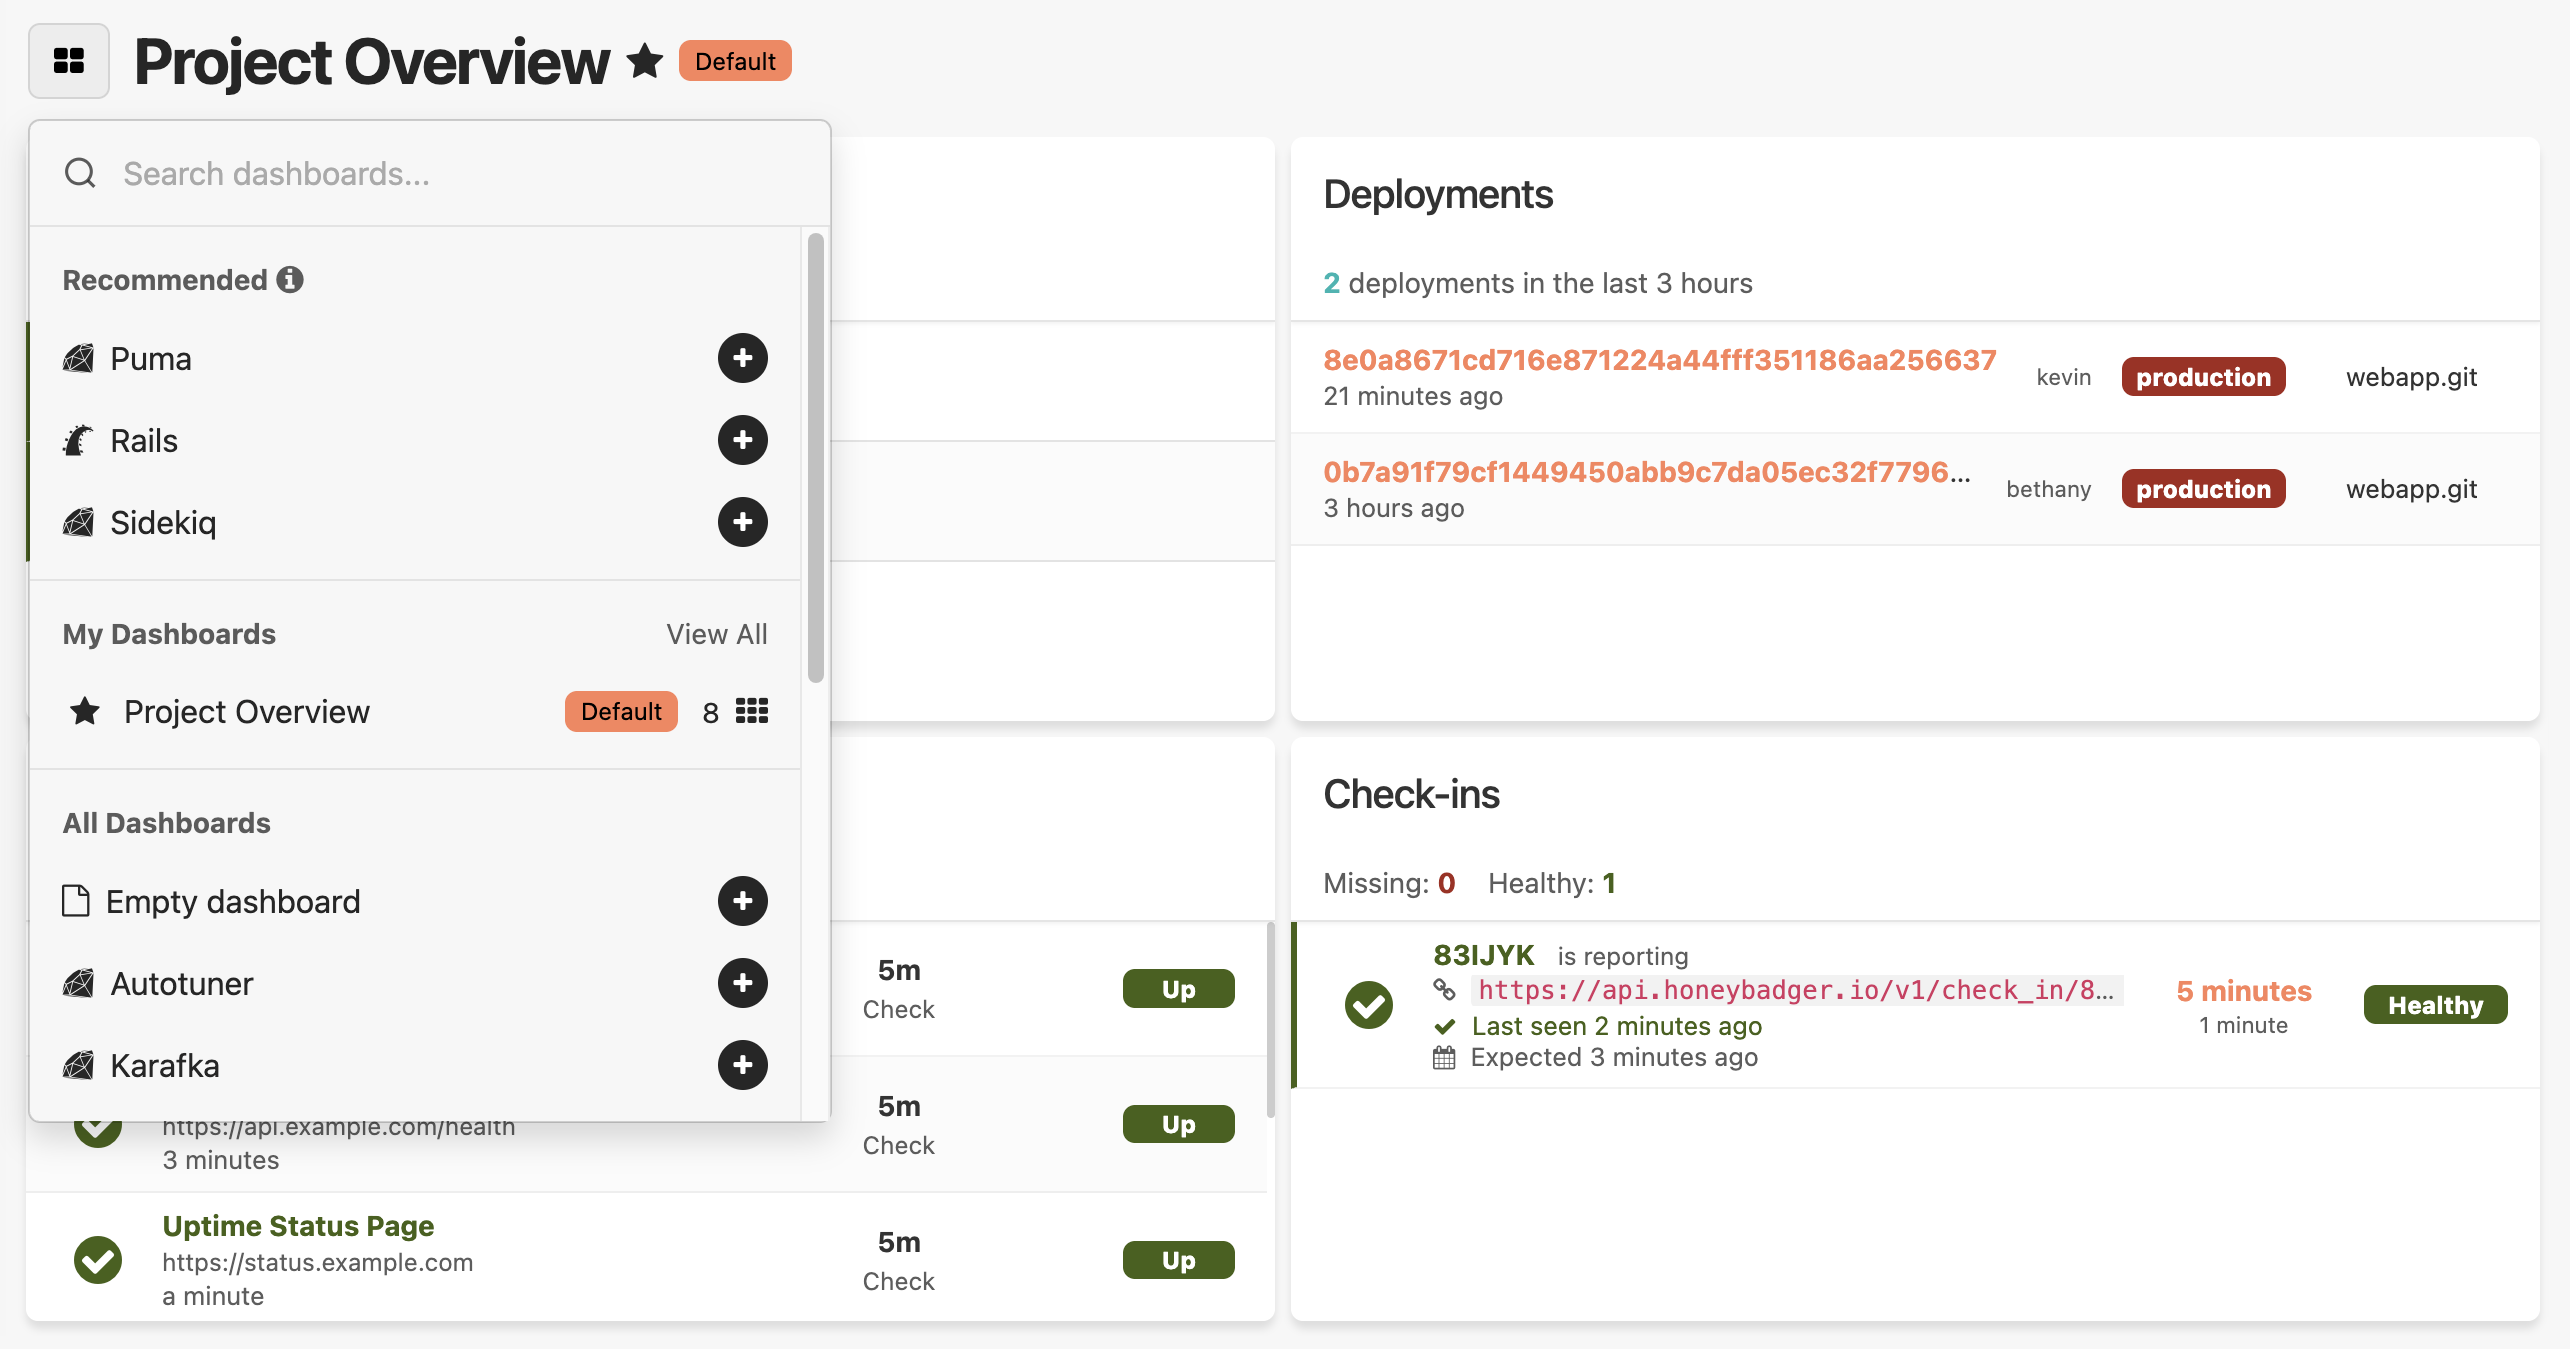
Recommended dashboards for a Rails project in Honeybadger
You can also now change your default project dashboard and star your favorite dashboards to pin them to the top of the list. We've been using these new dashboards internally to monitor Honeybadger, and it's been a big improvement to our daily workflow.
Create custom dashboards from the widget library
Need something more unique? We also made it easier to build your own dashboards. You can now create and edit widgets without leaving the dashboard you're working on. Click any widget to expand the inline query editor, make your changes, and see the results instantly.
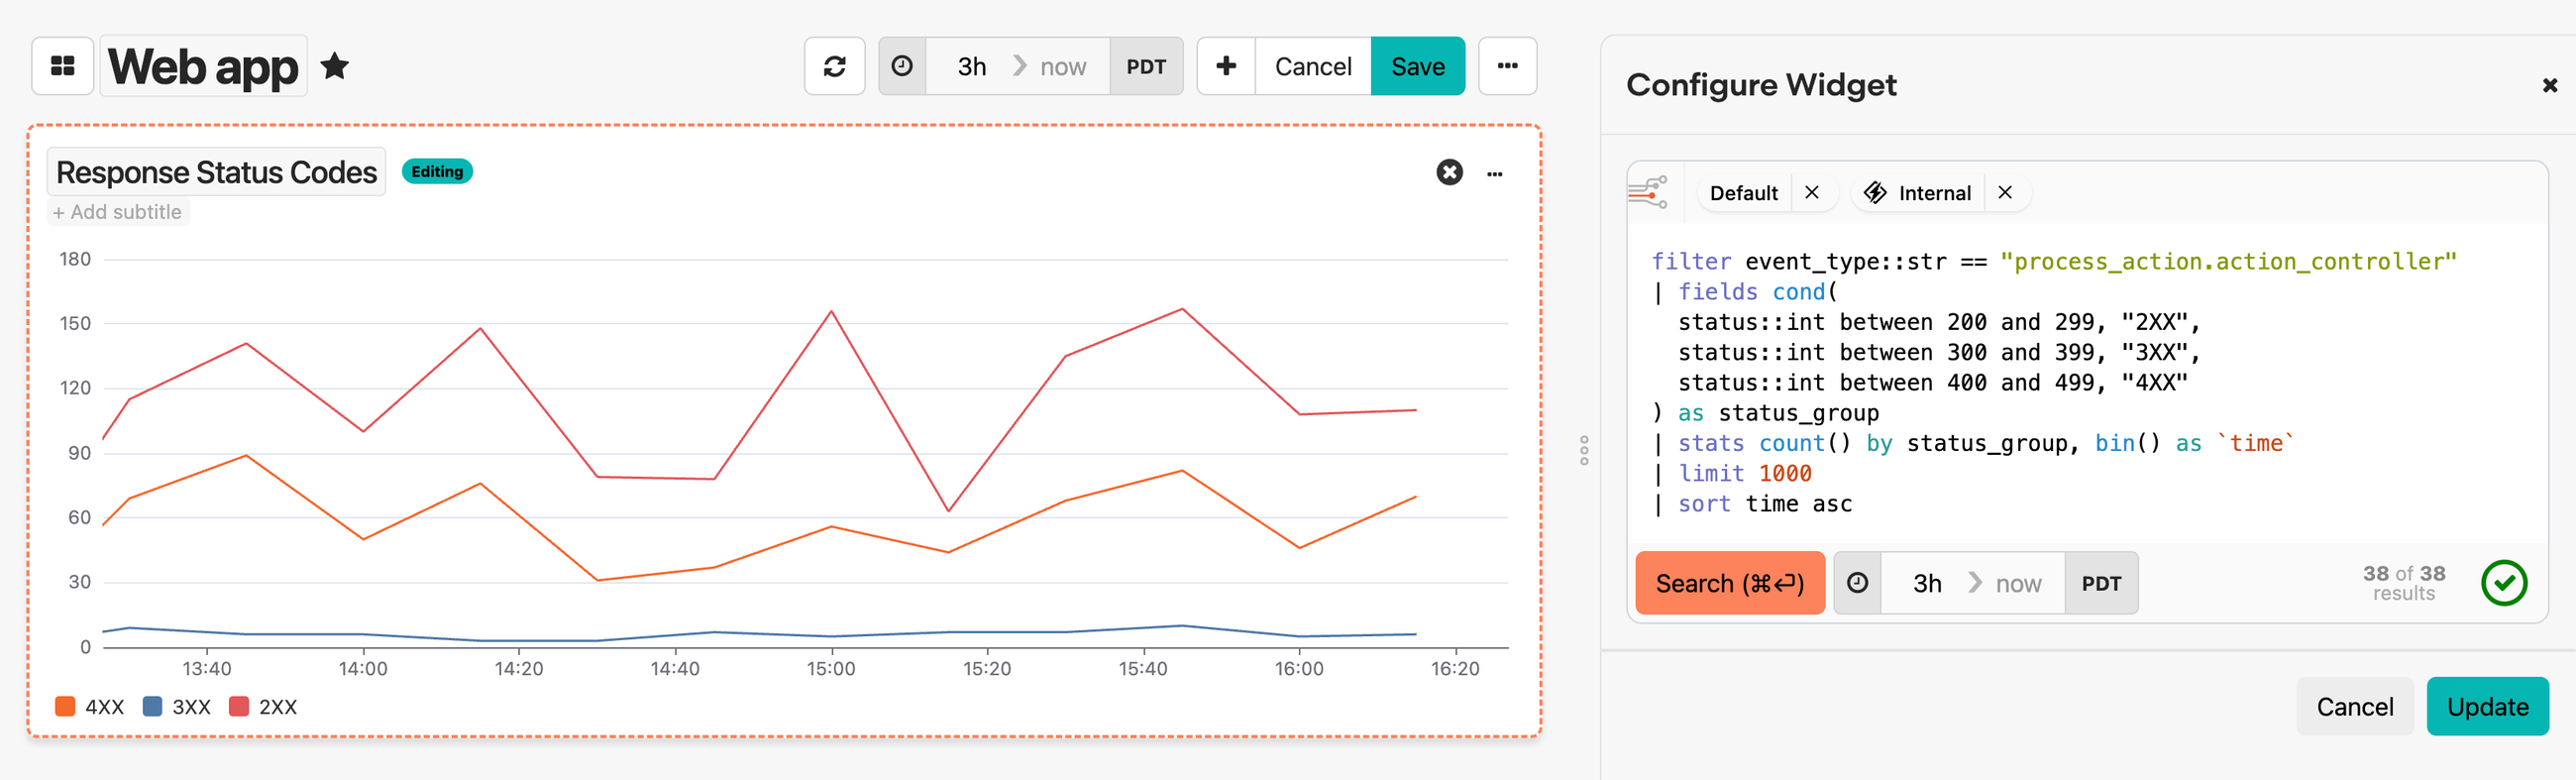
Honeybadger's inline widget configuration and query editor
When creating new widgets, choose from a widget library of pre-configured templates for common data sources:
- Error rates and deployments
- Database performance metrics
- Background job processing times
- Request counts and response distributions
- Cache hit rates and more
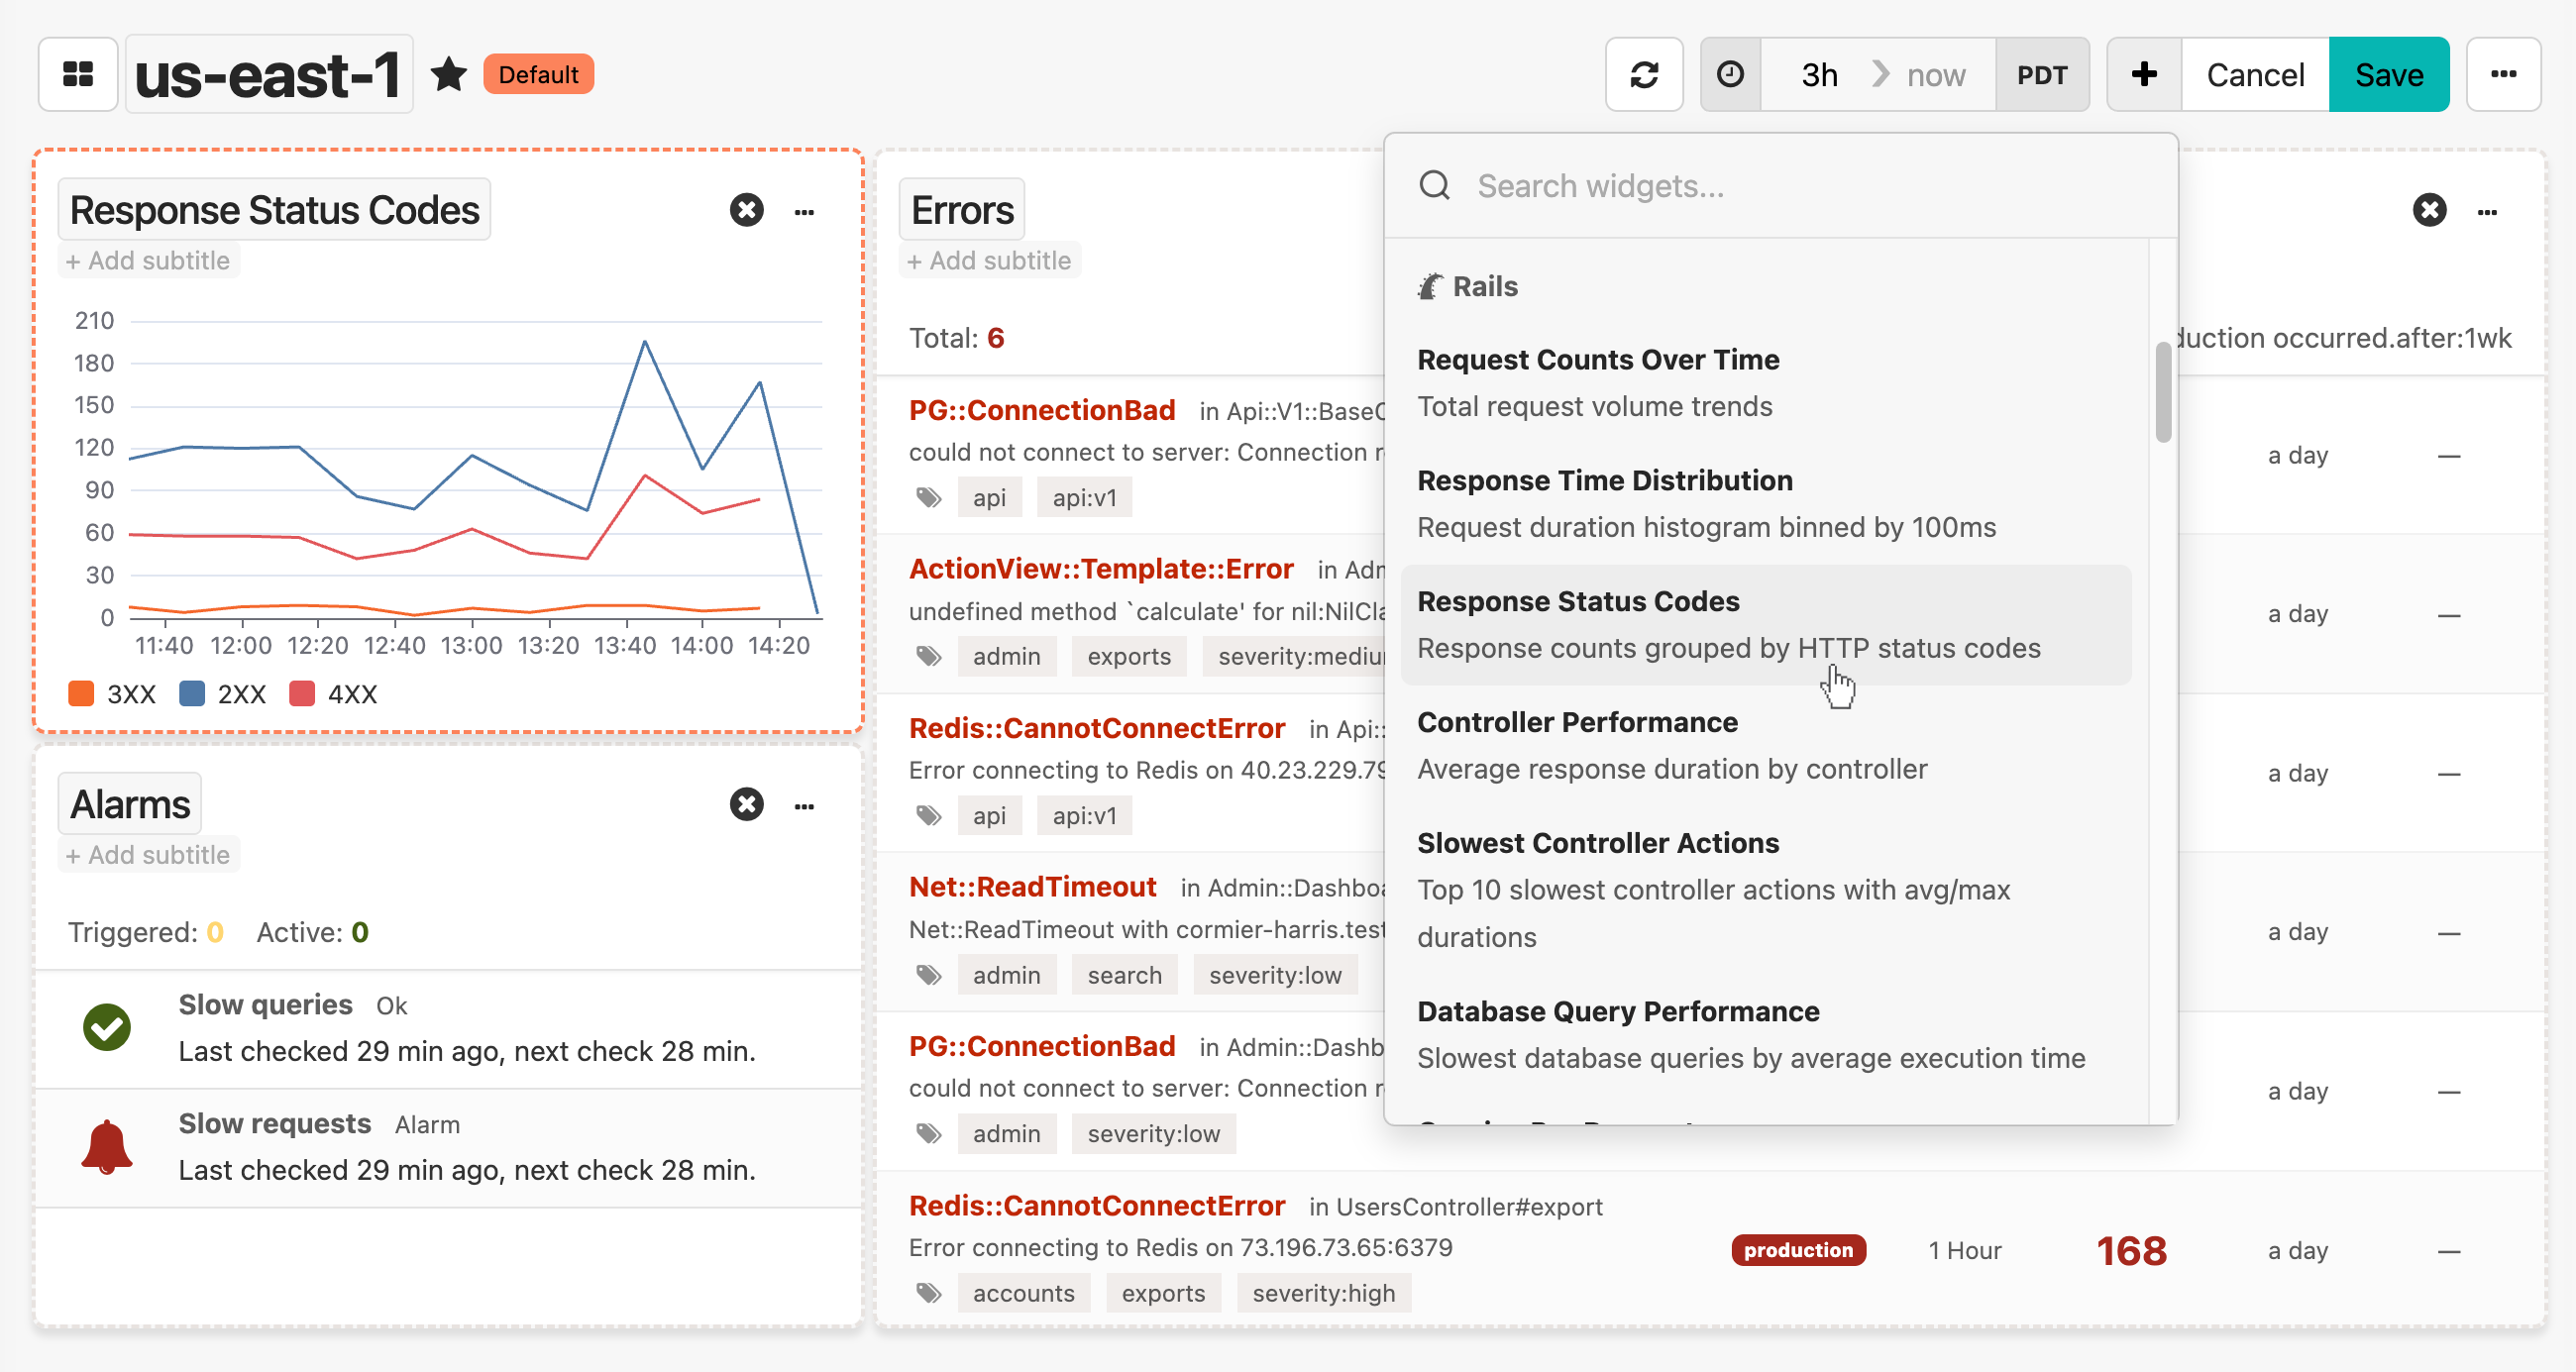
Honeybadger's drag and drop widget library
We're particularly excited about this change because as we add new automatic dashboard templates, the widget library will grow. More to come!
Getting started with dashboards
The new project overview dashboard and UI enhancements are available immediately for all Honeybadger accounts. Head on over to your Honeybadger project and click on the "Dashboards" tab to get started. For details related to your application framework, see our announcements for Ruby, Laravel, Elixir, and Python.
Try Honeybadger for FREE
Honeybadger is full-stack application monitoring that helps developers move fast and fix things. Get set up in minutes and check monitoring off your to-do list.
Easy 5-minute setup — No credit card required