System dashboard for server monitoring
We added an automatic System dashboard template for visualizing host metrics collected by the Honeybadger CLI agent.
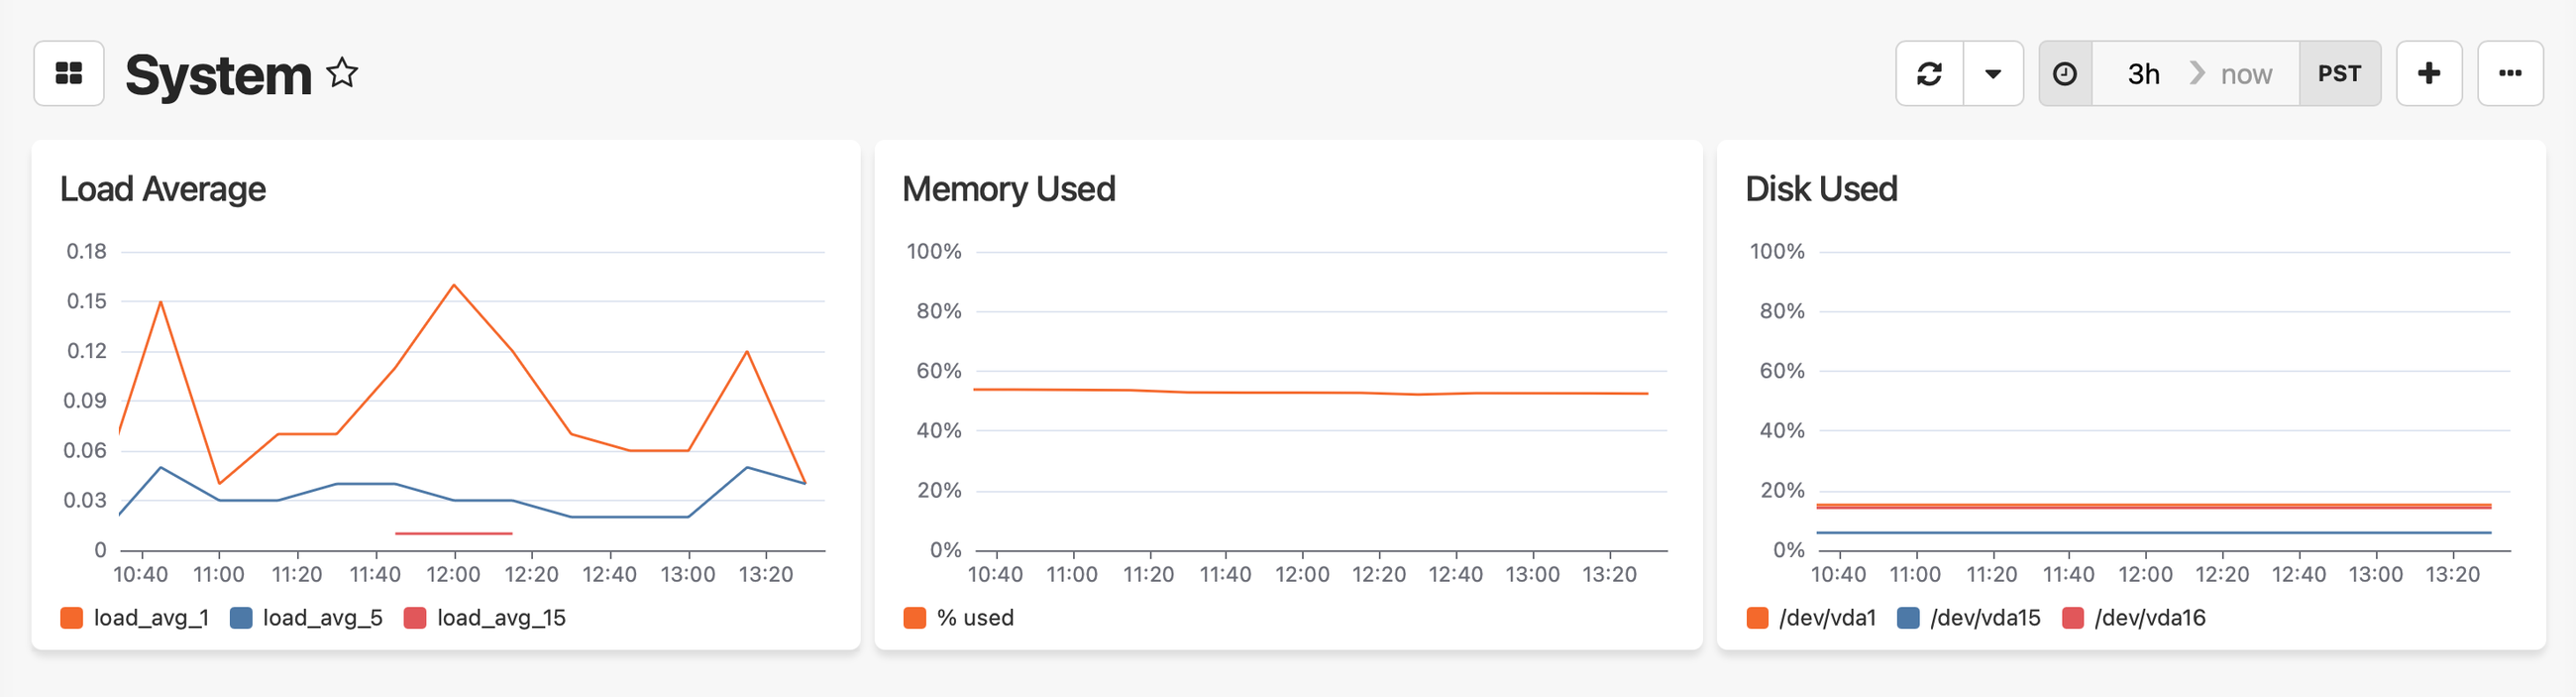
The dashboard includes three widgets, which you can also add to your existing dashboards from the widget library:
- Load Average — Line chart showing CPU load averages at 1, 5, and 15-minute intervals
- Memory Used — Line chart showing memory usage as a percentage over time
- Disk Used — Line chart showing disk usage percentage per device, so you can see at a glance which volume is filling up
Reporting host metrics to Honeybadger
To use the System dashboard, you'll need the Honeybadger CLI agent installed and sending system metrics to Insights. See the host metrics docs for setup instructions.
Once you're reporting data, create a new dashboard and select the System template from the template picker.
See the dashboards guide for more on working with dashboards.
Try Honeybadger for FREE
Honeybadger is full-stack application monitoring that helps developers move fast and fix things. Get set up in minutes and check monitoring off your to-do list.
Easy 5-minute setup — No credit card required