Apdex scores for your Rails dashboards
Knowing your app is "slow" isn't enough—you need to know how slow, and where. That's where Apdex comes in. Apdex (Application Performance Index) gives you a single score from 0 to 1 that reflects how satisfied your users are with response times. It's the same metric you may know from tools like New Relic, and it's now available for your Rails dashboards in Honeybadger.
We've added two new widgets to the widget library:
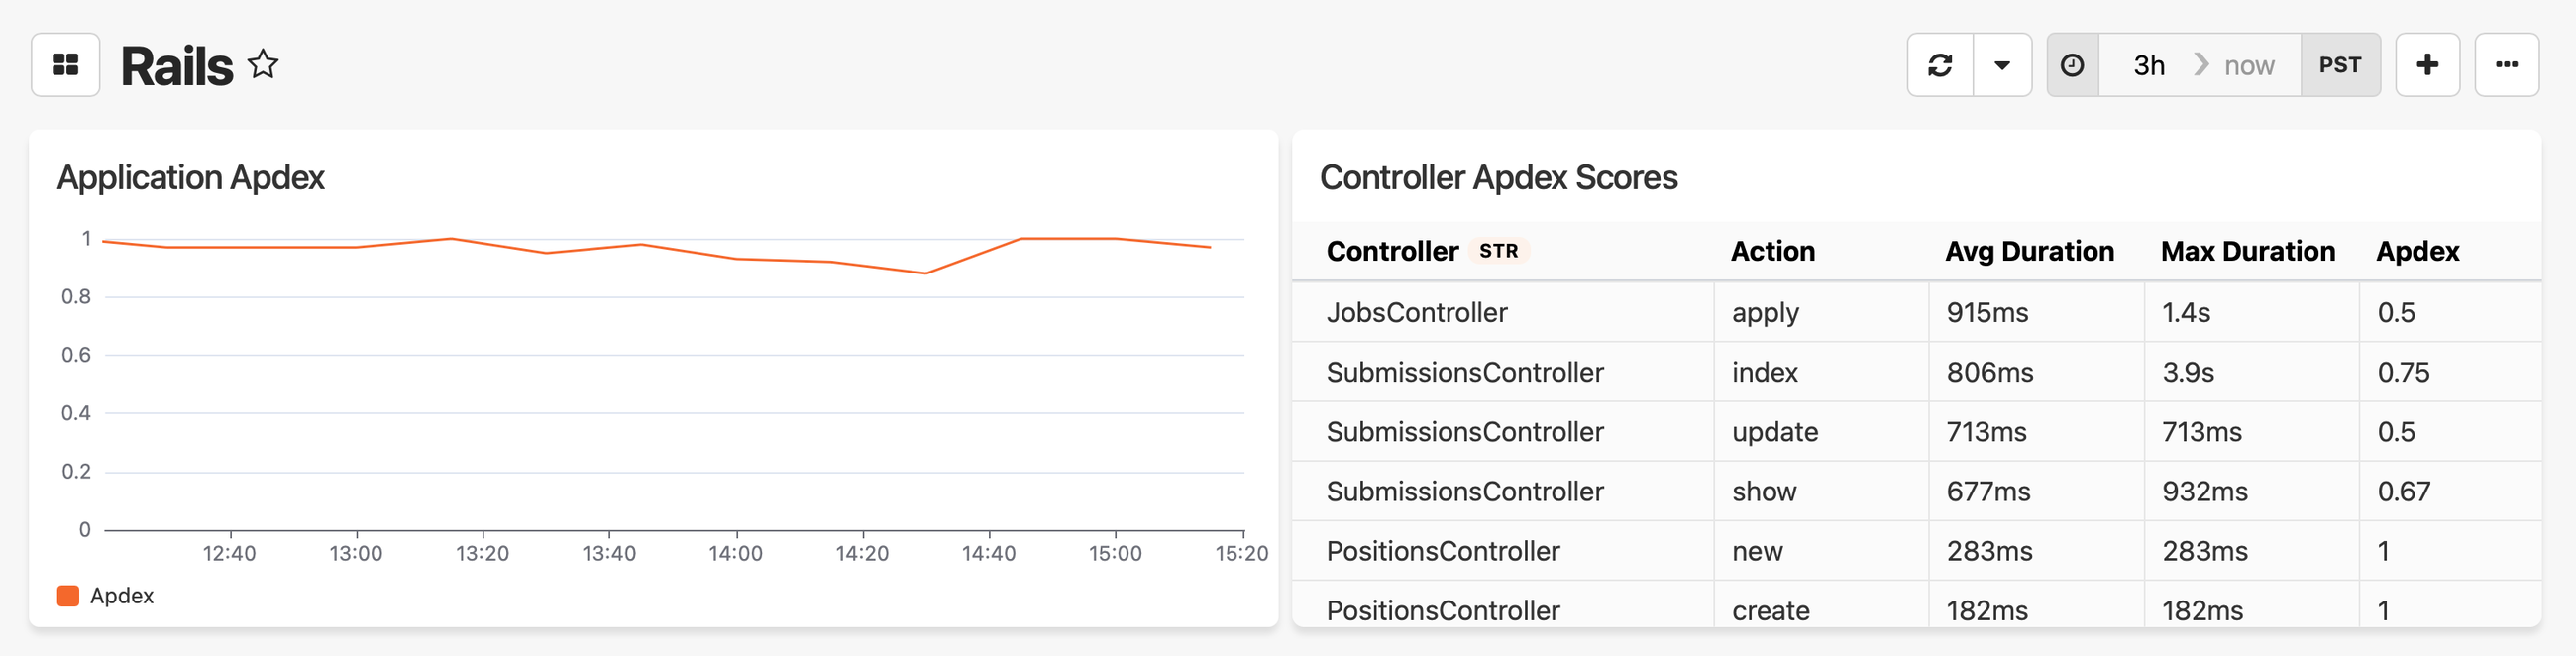
Application Apdex: A line chart showing your overall Apdex score over time. Use this to answer "how is my app doing?" at a glance—spot trends, catch regressions after deploys, and track performance improvements over time.
Controller Apdex Scores: A table showing the top 10 slowest controller actions with their individual Apdex scores, average duration, and max duration. When your overall score dips, this is where you go to find out which endpoints need attention.
How it works
Both widgets use a default threshold of 500ms—requests faster than that are "satisfied," requests up to 2000ms (4× the threshold) are "tolerating," and anything slower is "frustrated." The score itself is a weighted average that corresponds to satisfied = 1, tolerating = 0.5, and frustrated = 0.
If you have controllers where a longer response time is expected (like a reporting endpoint), you can set a custom threshold per-controller by adding apdex_threshold to your event context:
class SlowController < ApplicationController
  before_action :set_honeybadger_context

  private

  def set_honeybadger_context
    Honeybadger.event_context(
      user_id: current_user&.id,
      user_email: current_user&.email,
      apdex_threshold: 700
    )
  end
end
Adding the Apdex widgets to your dashboard
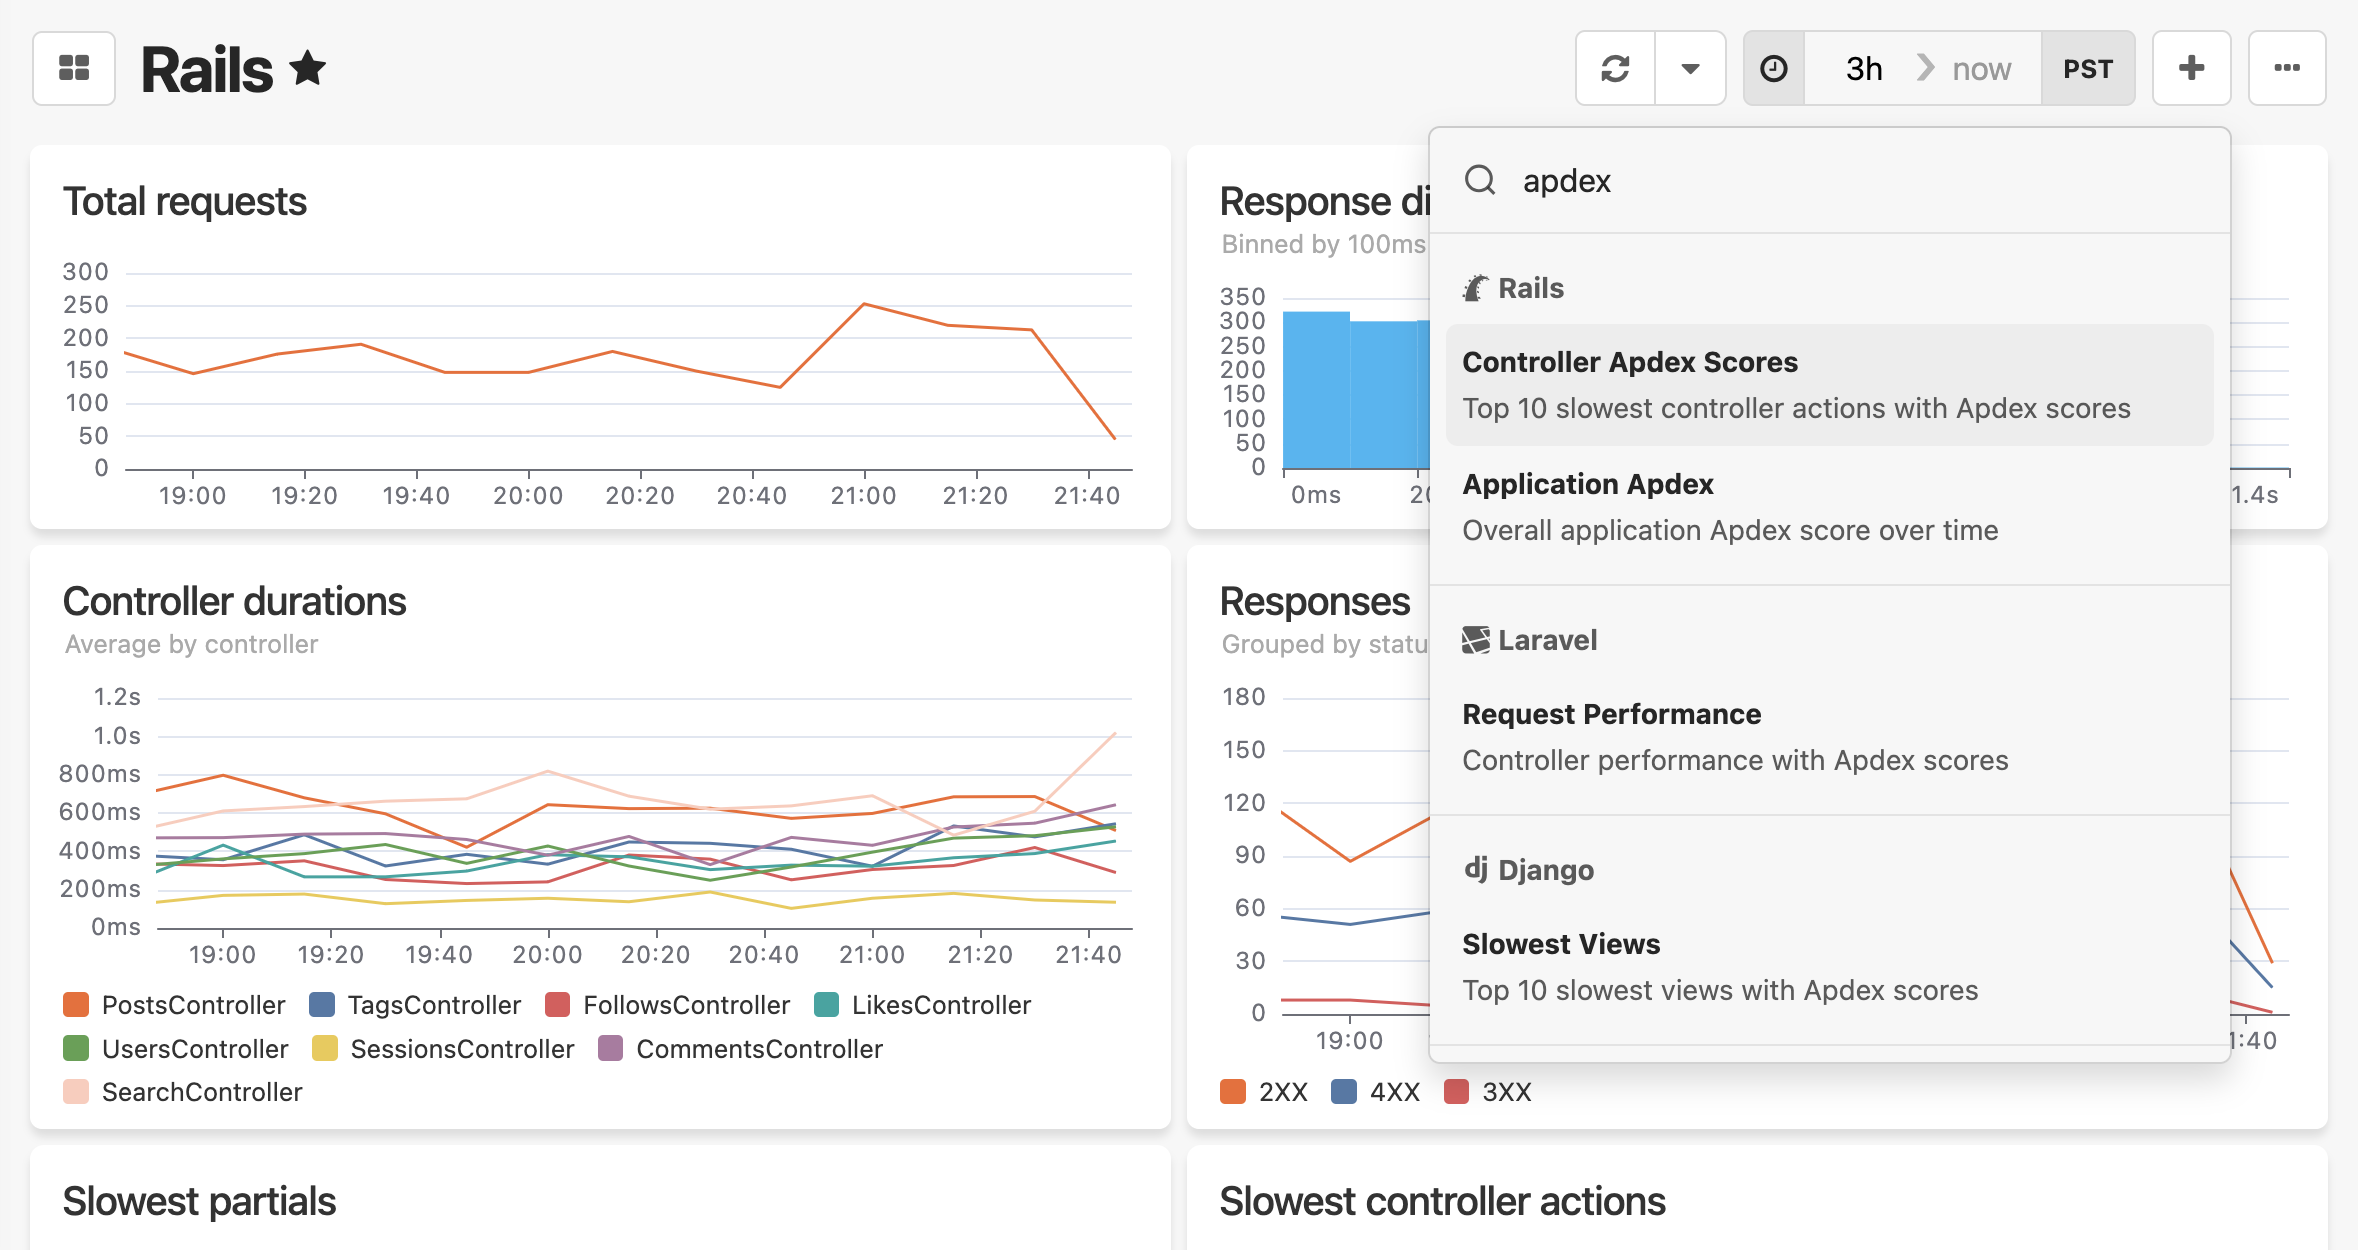
The Apdex widgets are available in the widget library. To add them, click the + Add widget menu in the top right corner of your dashboard and search for "apdex". Select either widget to add it to the dashboard.
The Apdex widgets are powered by Honeybadger Insights. If you're on gem v6.0+, Insights is enabled by default. If you're on an older version (v5.11+), enable it manually in your honeybadger.yml:
insights:
  enabled: true
See the Sending events to Insights guide for more details.
Try Honeybadger for FREE
Honeybadger is full-stack application monitoring that helps developers move fast and fix things. Get set up in minutes and check monitoring off your to-do list.
Easy 5-minute setup — No credit card required