Active Job performance monitoring for Rails
When background jobs slow down and pile up, you often find out the hard way. The new Active Job dashboard gives you a real-time look at your job performance, powered by Honeybadger Insights.
It works with Solid Queue, GoodJob, and any other Active Job backend. No extra configuration required.
What's included
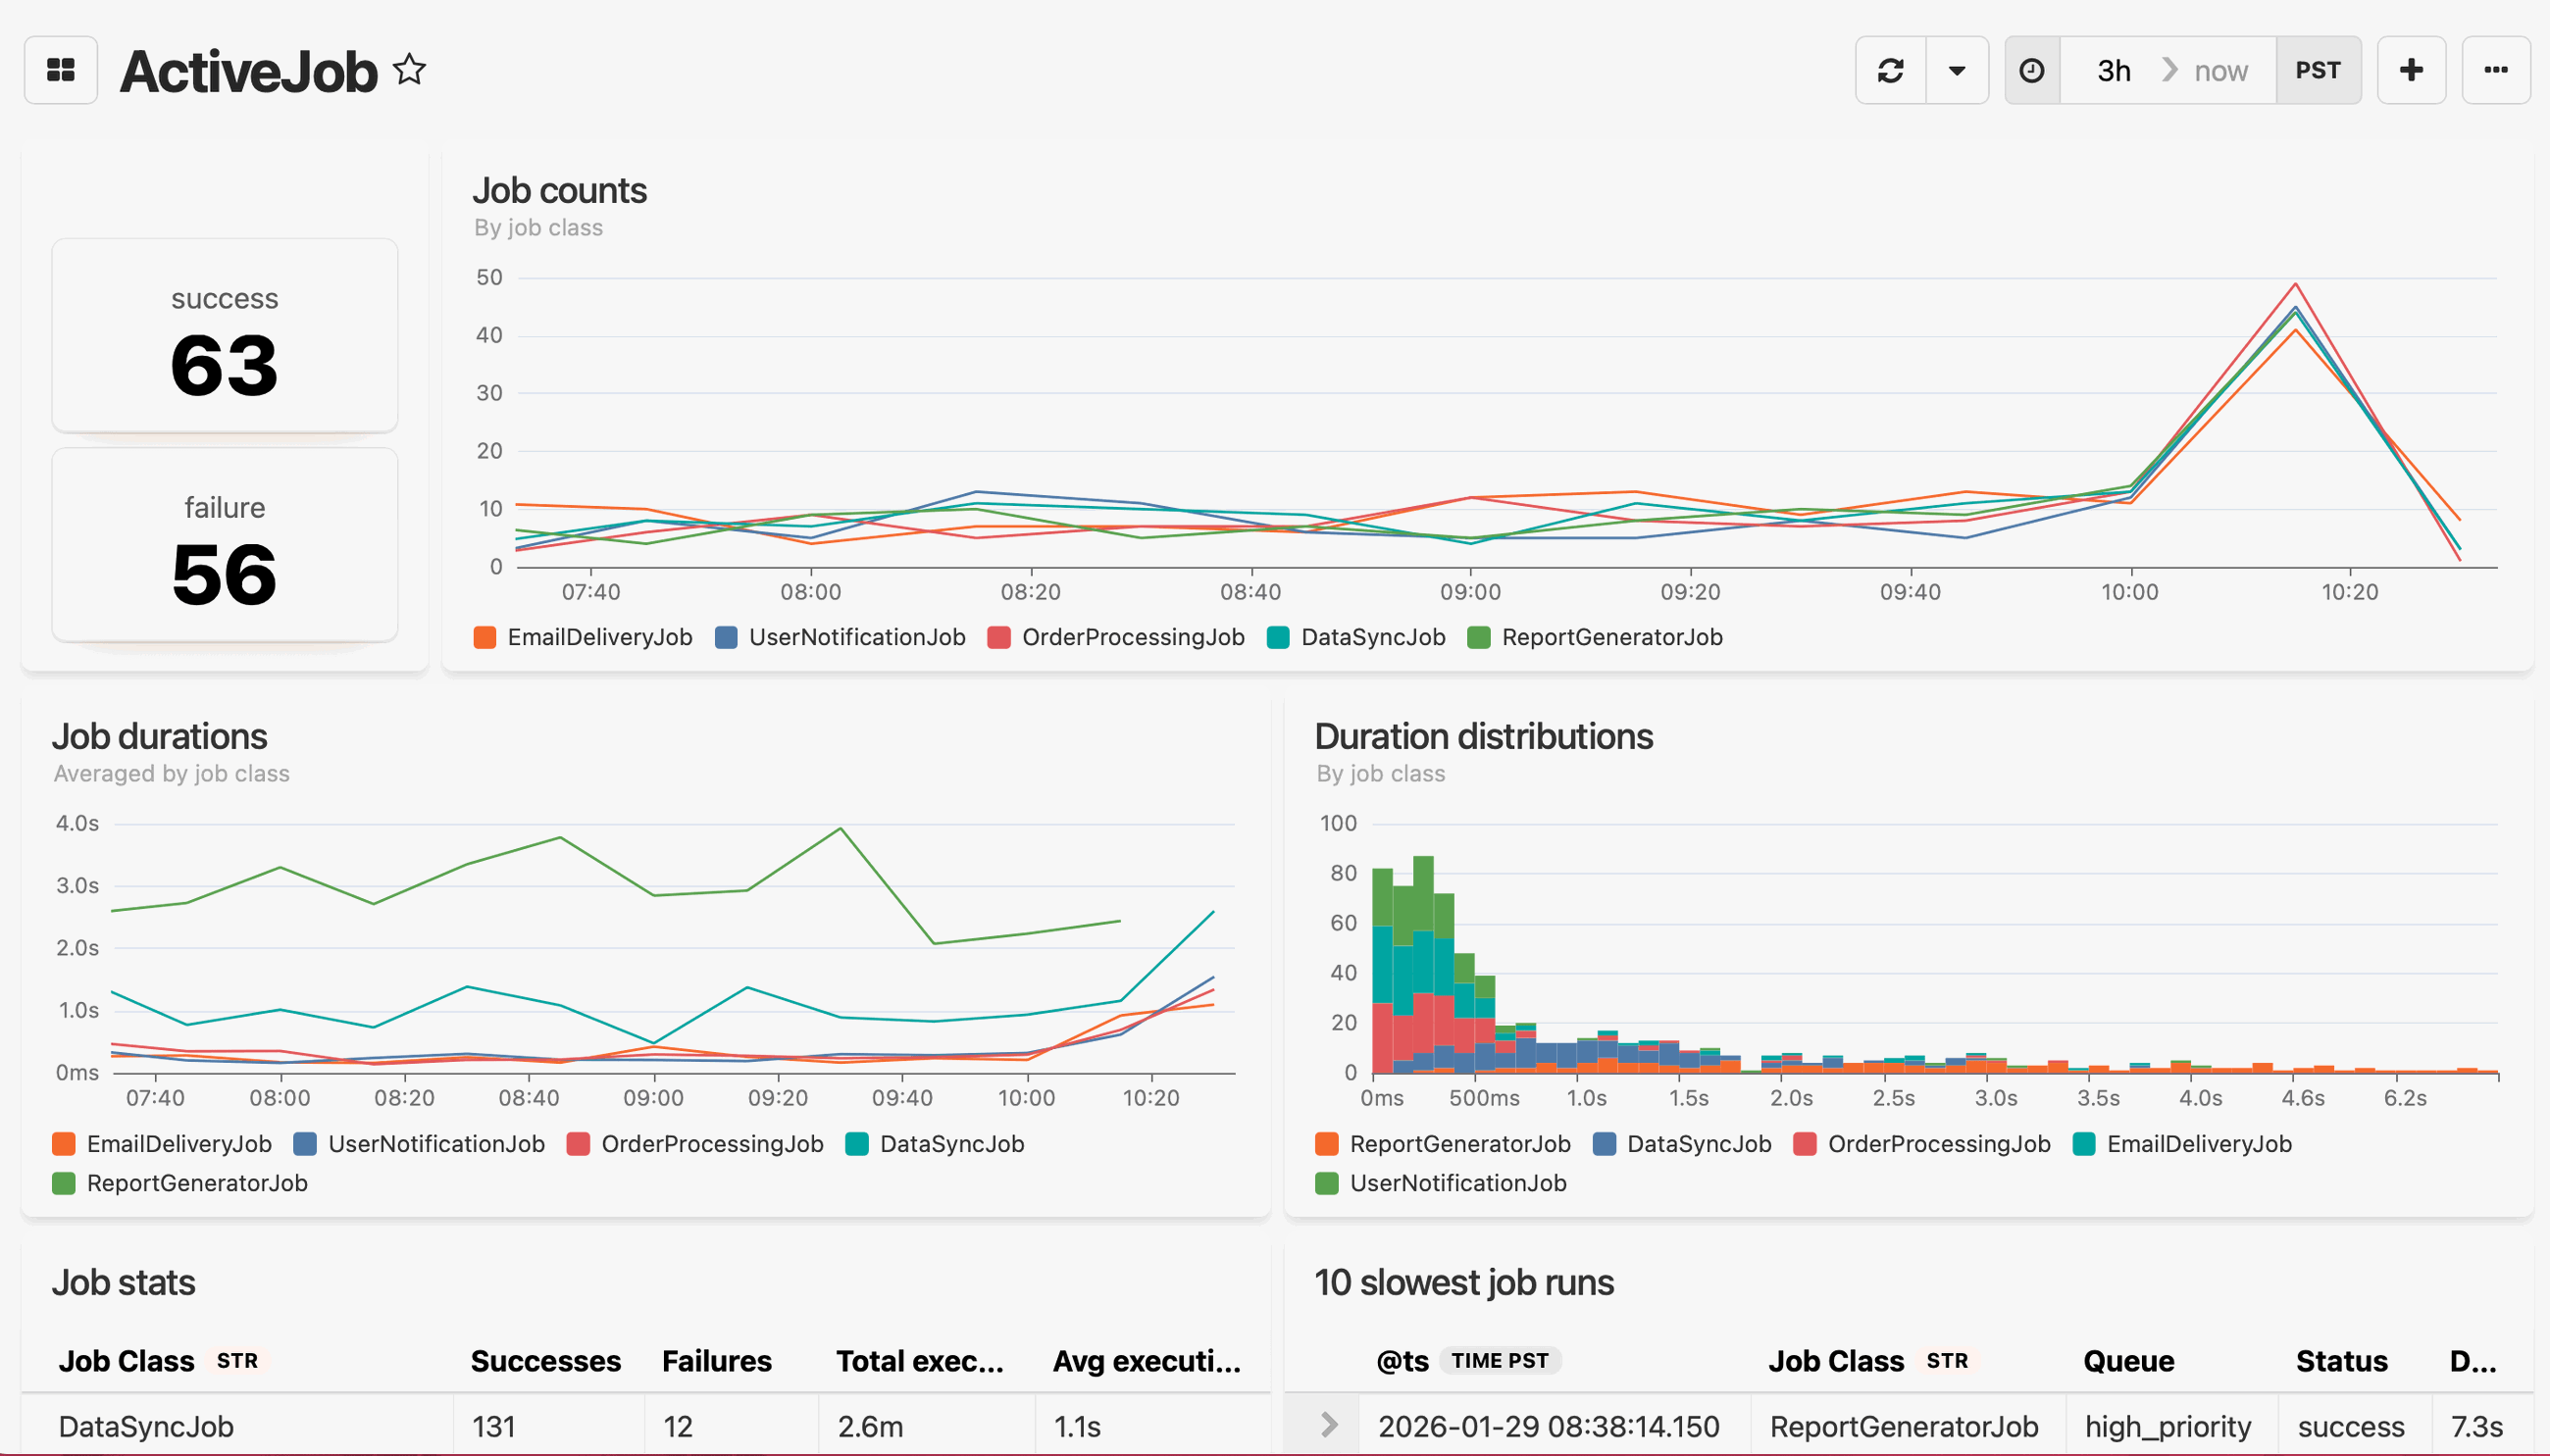
The dashboard has six pre-built widgets, which you can also add to your existing dashboards from the widget library:
- Job status counts: At-a-glance totals for successful and failed job executions
- Job counts over time: Volume by job class, plotted as a line chart
- Average job duration: How long each job class takes, averaged over time
- Duration distributions: A histogram showing the spread of durations by job class (binned at 100ms)
- Job stats table: Per-job-class breakdown of successes, failures, total execution time, and average execution time
- 10 slowest job runs: The worst offenders, with job class, queue, status, and exact duration
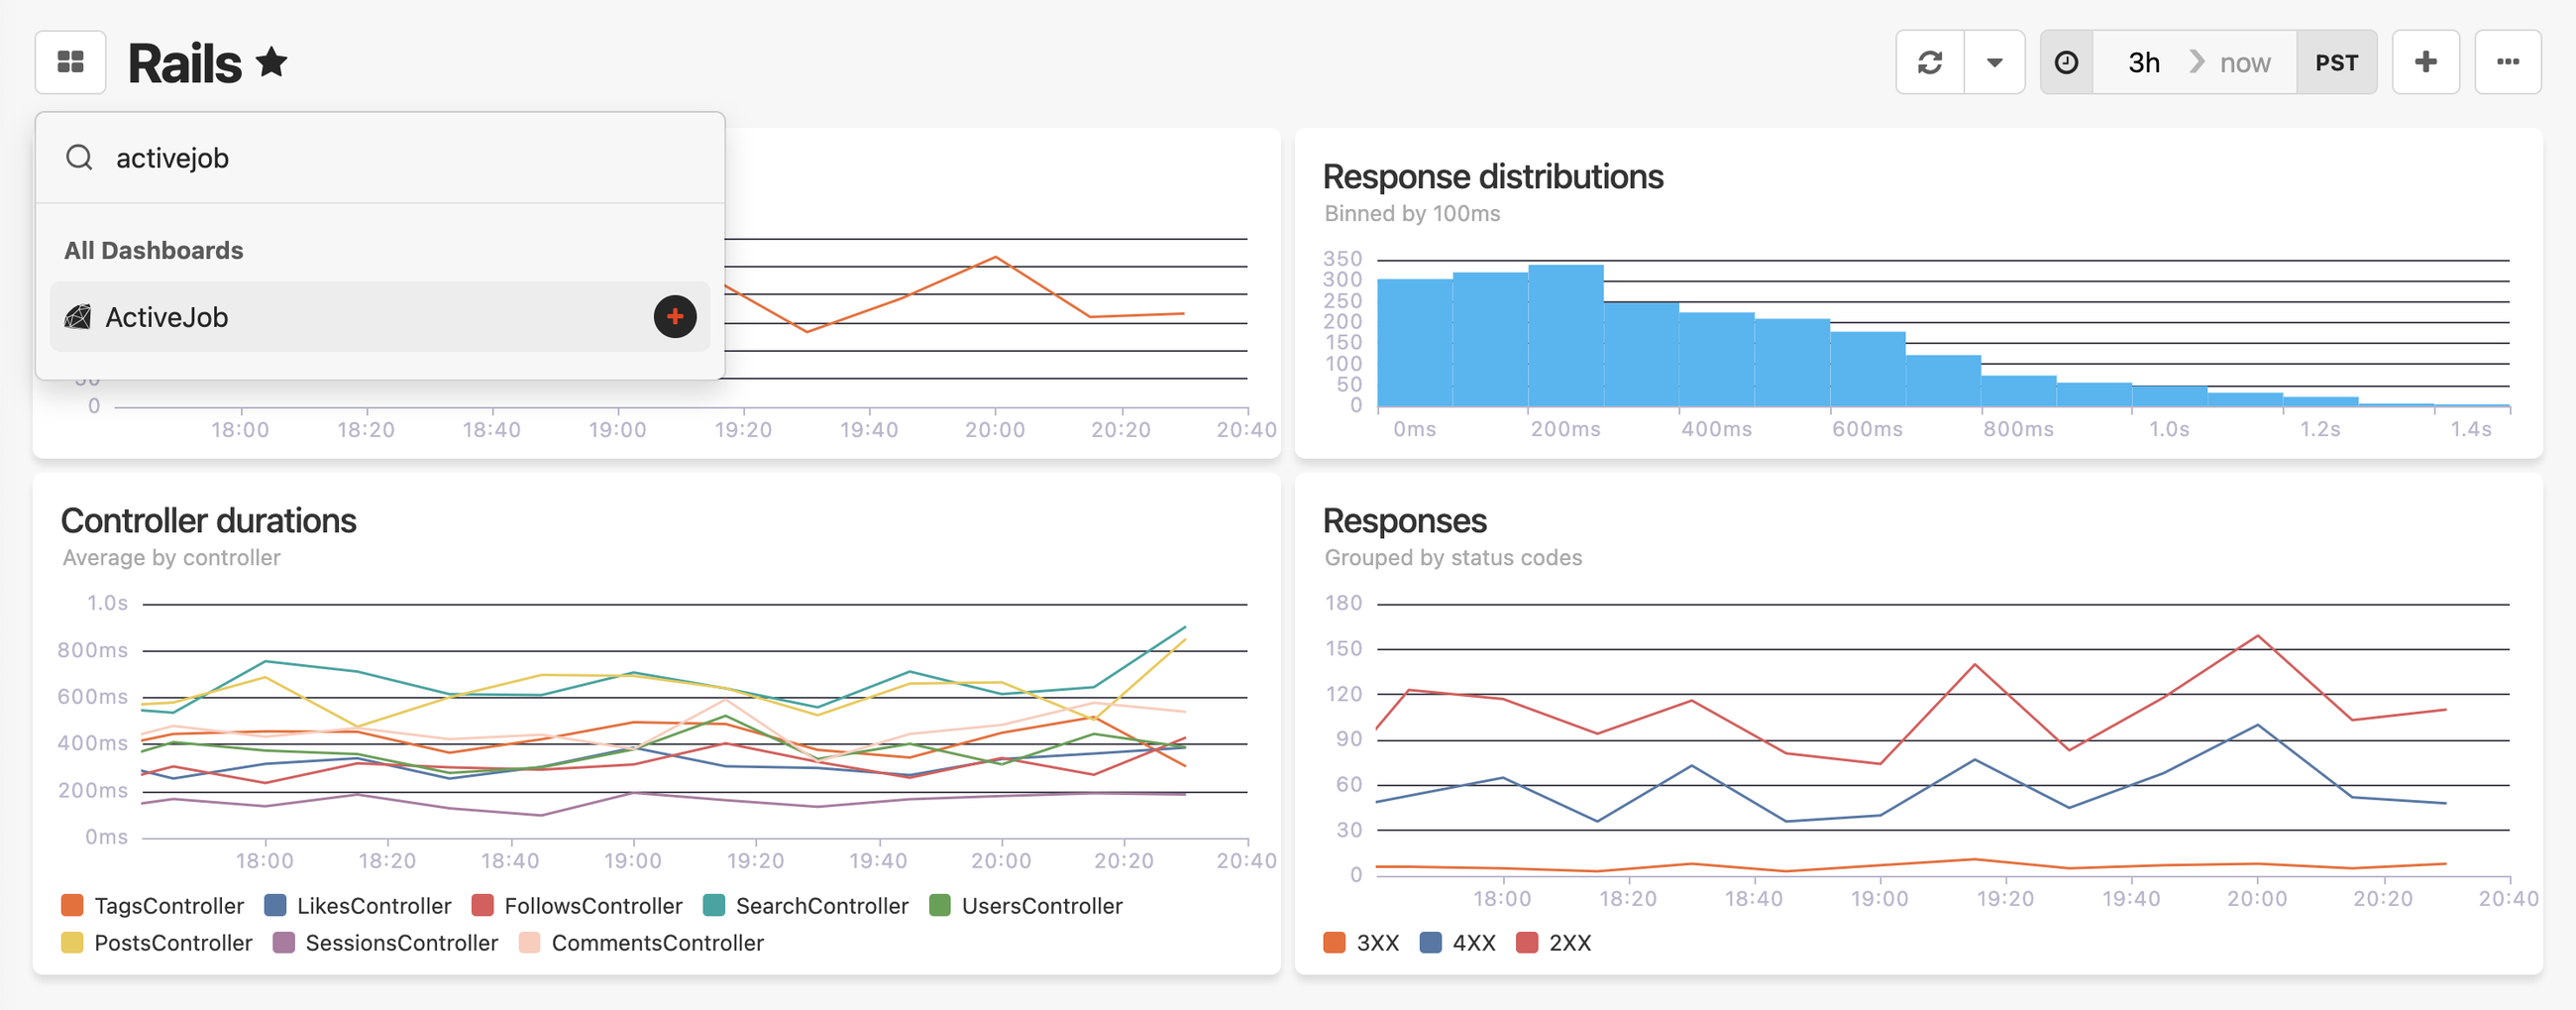
Getting started
Make sure you're on honeybadger gem >= 6.3 with event reporting enabled. Then add the Active Job dashboard from the dashboard selector in your Honeybadger project:
The Active Job dashboard is available now for all Honeybadger accounts. See the Dashboards guide to learn more.
Try Honeybadger for FREE
Honeybadger is full-stack application monitoring that helps developers move fast and fix things. Get set up in minutes and check monitoring off your to-do list.
Easy 5-minute setup — No credit card required