Heroku logs and you: a complete guide
Heroku's logging system is your primary window into application behavior, but its ephemeral nature and streaming architecture can feel mysterious at first. This guide walks through everything developers need to know about Heroku logs, from understanding what they are and how to access them, to working around their limitations and forwarding them to external services like Honeybadger Insights for complete observability. Read on to master Heroku logging.
When developers talk about Heroku, one ofthe first things that comes up is how easy it makes the task of deploying applications and how little you need to worry afterwards. You push your code to Heroku like any other remote repository, and Heroku takes care of provisioning the dynos, configuring the add-ons, and getting your application up and running in no time.
This is made possible by the level of abstraction provided by Heroku. But abstraction also creates blind spots. When something goes wrong—maybe your app is throwing errors, dynos are restarting, or a recent config change broke production—how do you know what actually happened? That's where Heroku logs come in.
Logs are your primary window into an application’s behavior. They tell the story of what your code is doing, how the platform is responding, and what the end user might be experiencing. The challenge is that Heroku’s logging system can feel a bit mysterious at first: it’s ephemeral, it streams from multiple sources, and it doesn’t store anything permanently.
In this guide, you’ll learn everything you need to know about working with Heroku logs:
- What they are and where they come from,
- The different types available,
- How to check and view them (
heroku logs --app your-app,heroku logs --tail), - Their limitations and best practices
- How to forward logs to external services like Honeybadger Insights for a complete observability solution.
By the end, you'll not only understand how to use Heroku's built-in logging but also how to extend it for production-grade monitoring.
What are Heroku logs?
At its core, a log is just a record of events. In the context of web applications, logs are indispensable: they capture errors, requests, system notifications, and custom messages you add with tools like console.log in Node.js or logger.info in Ruby. Without them, you lose visibility into your application, and debugging quickly becomes guesswork.
On Heroku, logging is powered by a system called Logplex. Think of Logplex as a router for logs. Instead of writing logs to files on disk—which doesn’t work well in Heroku’s ephemeral filesystem—your app and the platform stream logs to Logplex, and from there you can consume or forward them.
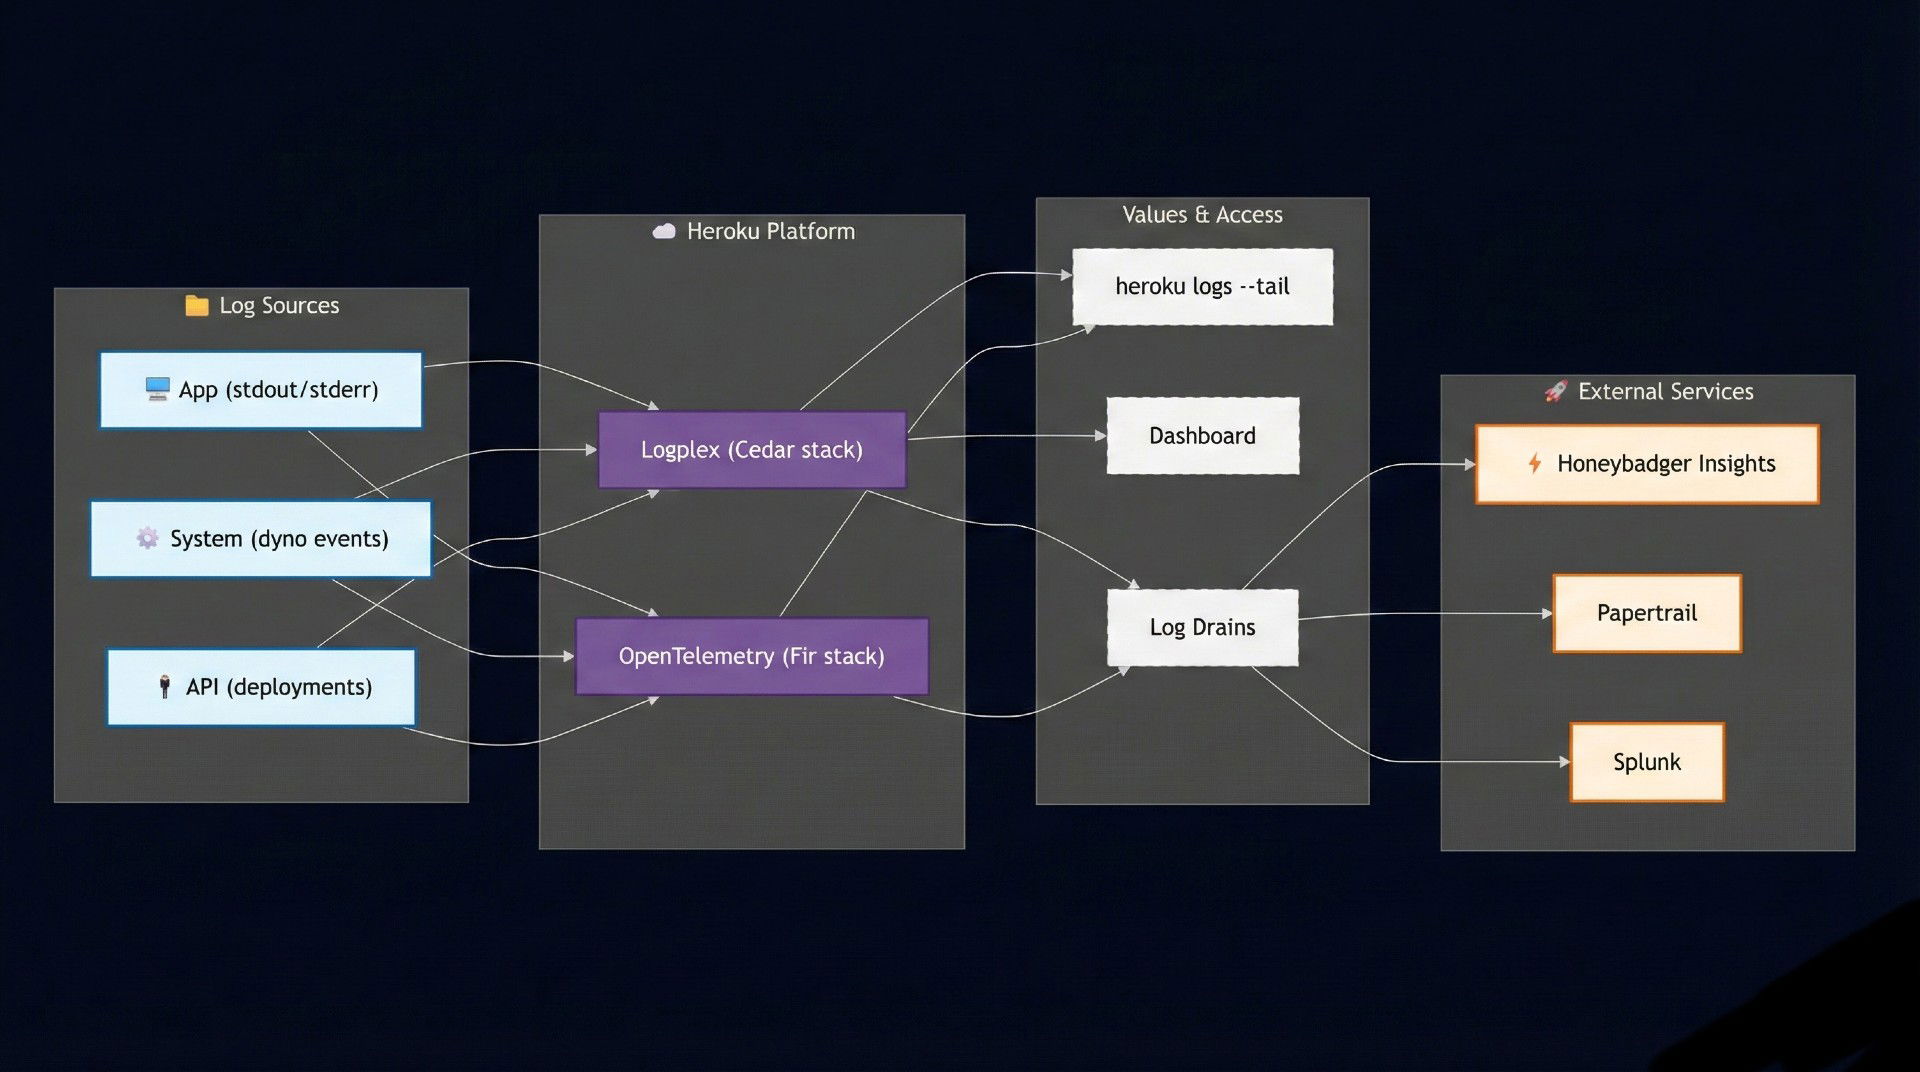
Data flows into Logplex from several sources:
- Application output – Everything your app writes to
stdoutandstderr. This includes framework logs (Rails, Django, Express, etc.), print statements, and runtime errors. - System logs – Events generated by the Heroku platform, such as dyno start/stop, restarts, and scaling actions.
- API logs – Records of actions you or your team perform via the Heroku API or dashboard, like deployments, config var changes, or add-on provisioning.
For example, here’s a small slice of log output you might see after deploying:
2025-09-16T12:01:44.567+00:00 heroku[web.1]: Starting process with command `node server.js`
2025-09-16T12:01:45.789+00:00 app[web.1]: Server listening on port 3000
2025-09-16T12:01:46.123+00:00 heroku[api]: Release v23 created by user@example.com
Notice how the entries come from different sources (heroku[web.1], app[web.1], heroku[api]) but are aggregated into one unified stream. Each log line follows a consistent structure: a timestamp, the source (such as the platform, your app, or the API), and the output message.
One critical detail: Heroku logs are ephemeral, which means they'll be lost after a certain period of time depending on the overall volume of logs being generated. Logplex maintains a buffer of around 1,500 lines, and once entries roll out of that buffer, they’re gone—effectively meaning they’ll disappear after a certain time depending on log volume. There’s no built-in long-term storage or search.
This makes Heroku logs essential in the moment: even though they don't last forever, they provide the immediate visibility you need to diagnose and resolve issues in real time. Later in this article, we'll also see how you can forward these logs to external services so they're preserved before they disappear.
Types of Heroku logs
Heroku groups its logs into a few key categories. Understanding the distinctions helps you know where to look when something breaks or when you're trying to monitor your application's health.
1. System logs
System logs are generated by the Heroku platform itself. They track what’s happening to your dynos and resources behind the scenes. Typical system-level events include dyno starts, stops, restarts, or scaling operations (docs).
Example:
2025-09-19T09:14:12.345+00:00 heroku[web.1]: State changed from starting to up
2025-09-19T09:14:14.678+00:00 heroku[router]: at=info method=GET path="/" host=myapp.herokuapp.com
These messages are useful for diagnosing infrastructure-level issues—like why your dyno restarted or whether scaling took effect. So if it feels like the problem isn't in your app but in the underlying system itself, the system logs are the first place you should look.
2. Application logs (Heroku app logs)
These logs come directly from your app. Anything written to stdout or stderr shows up here, from framework-level messages to your own custom logging. If you're running a Node.js service, a simple console.log("Server started") will appear in your application logs, and in a Python app, a print("Server started") statement would show up in the same way (docs).
Example:
2025-09-19T09:15:02.001+00:00 app[web.1]: Connected to database successfully
This is often the first place developers look when debugging unexpected behavior. So if you feel like it's not the system but your app that's acting up, the application logs are where you should start.
3. API logs
API logs track administrative actions performed on your app via the Heroku API or dashboard. This includes code deployments, config var updates, and add-on provisioning (docs).
Example:
2025-09-19T09:16:10.456+00:00 heroku[api]: Release v24 created by user@example.com
2025-09-19T09:16:11.789+00:00 heroku[api]: Add-on papertrail:choklad added by user@example.com
These logs are especially helpful for auditing team changes or confirming a deployment happened. You should look here to see when the latest deployment occurred or which configuration variable was updated.
Note on error messages: Error logs aren't a separate category—they appear within your application logs and system logs. When your app throws an exception, it shows up in the app logs. When the platform detects a crashed dyno or failed request, you'll see it in the system logs. Heroku also uses specific error codes (like H10, R14) to categorize common platform-level issues, which appear in system log entries.
How to check Heroku logs
Now that you know the different types of logs Heroku provides, the next step is learning how to access them. Like a lot of other things, Heroku makes it very straightforward whether you're working in the CLI, monitoring live traffic, or just doing a quick inspection from the dashboard.
Using the Heroku CLI
The Heroku CLI is the primary tool for viewing logs. Assuming that you already have it installed and have authenticated it to your account, you can fetch recent logs with:
heroku logs --app your-app-name
By default, this command retrieves around 100 lines of your most recent logs on Cedar-generation apps. You can request up to 1,500 lines using the --num (or -n) flag. On Fir-generation apps, there's no log history, so heroku logs defaults to real-time tail instead.
Real-time streaming with heroku logs --tail
Instead of only viewing the logs already stored in the buffer, you can also stream them live as they arrive using the --tail command:
heroku logs --tail --app your-app-name
This keeps a session open and streams logs continuously until you exit. You'll often see this referred to as heroku tail logs. It's especially useful when you suspect a certain part of your application is causing an error and want to see it happen in real time by triggering that part.
Application logs examples
If you're running a Node.js app, your console.log and console.error statements appear automatically in the application log stream:
console.log("Server started on port 3000");
console.error("Database connection failed");
When people refer to Heroku Node logs, they generally mean the application logs produced by Node.js apps running on Heroku. Everything written with console.log() or console.error() appears automatically in the application log stream. In production, make sure to use structured loggers like Winston or Pino. This greatly improves readability and parsing.
If you’re running a Python app, the same principle applies. Output written with the built-in print() function or the logging module goes straight to the application logs:
import logging

logging.basicConfig(level=logging.INFO)
logging.info("Server started on port 8000")
logging.error("Database connection failed")
For production, you may want to use structured logging with libraries like structlog to provide JSON-formatted logs that are easier to parse and search.
Viewing logs in the dashboard
Even though the CLI is the primary and often the fastest way for checking logs, you can also view logs in the Heroku Dashboard by following these steps:
- Open your app in the dashboard.
- Click More > View Logs.
- A log panel appears with recent activity.
But note that this view is limited to a short history and does not support advanced filtering or real-time streaming.
Log sessions vs. log drains
Two concepts that are very important to understand in the context of logs in Heroku are log sessions and drains:
Log sessions (like heroku logs and --tail) are temporary streams that connect you directly to Heroku’s in‑memory buffer. They let you inspect what’s happening in real time or review the latest few hundred lines, but once you close the session or the buffer fills, those log lines are gone. They’re ideal for debugging on the fly, but not suitable for long‑term storage.
Log drains, on the other hand, are permanent connections that forward every log line from Heroku to an external service (e.g., Honeybadger Insights, Papertrail, or Splunk). This means your logs are retained, searchable, and can be visualized or combined with metrics. Drains are the way to go when you need serious monitoring, alerting, or compliance‑friendly retention.
For quick checks, a log session is enough. For serious monitoring and retention, you'll want to set up a drain.
Limitations of Heroku logging
Heroku's built-in logging is incredibly handy for quick debugging, but it's important to understand its boundaries before relying on it as your only source of truth.
Ephemeral storage is the biggest limitation. On Cedar-generation apps, Logplex maintains a finite buffer of around 1,500 lines that expire after 1 week. On Fir-generation apps, there's no log history at all—only real-time streaming is available. Once logs age out or fall off the buffer, they're gone forever. This makes Heroku logs unsuitable for long-term retention or compliance requirements.
There’s also no built-in search or filtering. If you’re tailing logs in real time (heroku logs --tail), you’re essentially watching an unfiltered firehose. That works fine for low-traffic apps, but as soon as you’re handling more requests, pinpointing a specific error message becomes difficult without piping logs into an external tool.
Another gap is the lack of analytics and alerting. Heroku logs are plain text streams. You won’t get charts, error rates, or performance trends from them directly. If you want proactive alerts when your app starts throwing 500 errors or if response times spike, you’ll need an external monitoring service.
In short: Heroku logs are perfect for short-term debugging and quick inspections, but they're not a full observability solution. For production apps, you'll almost always want to forward logs to a dedicated logging or monitoring platform.
Best practices for Heroku logs
Heroku logs are short-lived by design, so the real value comes from how you structure, enrich, and ship them. Following good logging practices can turn raw output into a reliable source of information for debugging, monitoring, and long-term analysis.
Here are some proven strategies you should adopt:
Write logs to stdout/stderr instead of files.
Heroku automatically captures console output but discards anything written to disk after a dyno restarts. Configure your logger to stream to stdout and stderr.
Use structured JSON for every log entry.
Free-form text is hard to search; JSON allows you to include level, timestamp, message, and contextual fields. Keep one JSON object per line for clean parsing. Example:
{
  "level": "info",
  "timestamp": "2025-09-30T10:15:42Z",
  "message": "Request completed",
  "request_id": "b7f3c19d",
  "method": "GET",
  "path": "/api/users",
  "status": 200,
  "duration_ms": 123,
  "dyno": "web.1",
  "release_version": "v42",
  "commit_sha": "1a2b3c4d"
}
Adopt consistent log levels.
Use standard levels like debug, info, warn, error, and fatal. This keeps the severity obvious and prevents drowning in noisy logs. Reduce or disable debug in production.
Attach correlation or request IDs.
Generate a unique ID per request (middleware can inject it) and log it across services. This lets you follow a request’s journey through routers, workers, and APIs.
Log request latency and status codes.
Include method, path, status, and duration_ms in logs. These metrics highlight slow endpoints, spikes in 5xx errors, and help monitor SLAs.
Protect sensitive data in logs.
Never write passwords, tokens, or PII. If context is needed, redact, mask, or hash values before logging.
Sample or rate-limit high-volume logs.
For endpoints with thousands of hits per second, log only a subset to prevent overwhelming your log drains (and on Cedar apps, to avoid filling the 1,500-line buffer).
Turn critical errors into alerts.
Integrate your log platform with notifications so repeated crashes or error spikes trigger alerts automatically. Don't wait to check manually.
Keep logs single-line friendly.
Multi-line entries (like stack traces) break parsers. Serialize them into JSON fields or escape newlines so each event remains a single line.
Include dyno and release metadata.
Add fields like dyno, region, release_version, and commit_sha to quickly link issues to a deployment or specific process.
Forward logs using drains.
Heroku’s buffer is short-lived. Add drains to services like Papertrail, Datadog, Splunk, or Honeybadger for search, retention, and dashboards.
Validate setup with heroku logs --tail.
Tail logs live during incidents to confirm structured output, correlation IDs, and metadata are flowing correctly.
By following these practices, your logs become human-readable for developers in the moment and machine-friendly for platforms that store and analyze them later. This dual focus ensures that logs don't just capture what happened—they actively support incident response, trend analysis, and system health monitoring. In effect, Heroku's ephemeral stream becomes a durable observability layer that grows with your application.
Sending logs to external services
Heroku's built-in logging system is great for development and lightweight monitoring, but it comes with serious constraints: logs are ephemeral, buffer size is limited, and advanced search or long-term retention simply aren't available out of the box. For production workloads where you need to investigate incidents weeks later, correlate events across services, or build alerts around error patterns, you'll quickly run into those limitations. That's where external logging services come in.
The mechanism for getting logs off the Heroku platform is called a log drain (Heroku docs), which we've briefly discussed before. To refresh your memory a drain is just an HTTPS or syslog endpoint that Heroku’s Logplex can stream your app’s log lines to in real time. You can attach multiple drains to an app—perhaps one for a general-purpose log aggregator and another for a security tool. Once set up, your logs flow continuously, and you’re free to use more powerful tools for storage, search, visualization, and analysis.
A wide range of log management providers integrate with Heroku drains. Services like Papertrail, Logentries, Splunk, and Coralogix extend your visibility far beyond what the dashboard or CLI can provide. Typical advantages include:
- Retaining logs for weeks or months instead of hours.
- Advanced query features to slice and dice by request ID, user session, or error code.
- Alerting pipelines to ping you when error rates spike or a deployment introduces regressions.
- Rich dashboards that help both engineers and non-technical stakeholders make sense of what’s happening.
There are some caveats. Drains transmit every log line, which can create cost considerations if your app produces a high volume of logs. You should also ensure that sensitive information (like passwords or tokens) isn’t logged in the first place, since external services will now hold this data. Despite these concerns, setting up a drain is considered best practice for staging and production environments where you can’t afford to lose insight.
Finally, it's worth noting that most external log services focus on log storage and search alone. They won't necessarily give you a unified view of errors, uptime, and monitoring in the same place. That's why in the next section we'll explore Honeybadger Insights, which combines log drains with error tracking and uptime monitoring for a more holistic approach.
How to send Heroku logs to Honeybadger
Honeybadger stands out from other services because it doesn't just handle log storage. It brings logs, error tracking, and uptime monitoring together under one roof. This unified view helps teams understand not only what errors occurred, but also how those errors affected users and whether the application was available at the time.
The process of connecting Heroku to Honeybadger builds on the log drain mechanism we have already discussed. You begin by signing in at app.honeybadger.io and creating or selecting a project for your Heroku application. Each project has its own API key, which you can find under Project Settings → API Keys. This is the key that authenticates your drain; it comes from Honeybadger, not from Heroku.
Once you have the API key, you can add a drain from the Heroku CLI. From inside your app directory, simply run:
heroku drains:add "https://logplex.honeybadger.io/v1/events?api_key=YOUR_PROJECT_API_KEY"
If you manage multiple environments—say, staging and production—you can also include an env parameter in the drain URL. For example:
heroku drains:add "https://logplex.honeybadger.io/v1/events?api_key=YOUR_PROJECT_API_KEY&env=production"
This attaches an environment field to every event, making it easier to filter and chart within Insights. After adding the drain, you can confirm that it’s active with:
heroku drains -a APP_NAME
Back in Honeybadger, open the Insights tab of your project. You’ll see dashboards populate in real time with Heroku log data—HTTP status code distributions, slow endpoints, and dyno-level details. Because the drain forwards every log line, you get the full picture in Insights, where you can run queries, build dashboards, and set up alerts. The optional env field makes it trivial to slice results by environment or pipeline stage.
Once data is flowing, the real power comes from how you utilize Honeybadger Insights. You can create saved queries to track specific patterns like slow requests or repeated 500 errors, build dashboards for different stakeholders, and set up alerts to proactively notify your team before issues escalate. Queries in Insights are flexible and expressive. For example, if you wanted to find all failed requests in production and display the route and status code, you could write:
filter environment == "production" and router.status >= 500
| fields @ts, router.method, router.path, router.status
| sort @ts desc
| limit 20
This query shows the last 20 server errors in production, along with timestamps and request details, which can immediately highlight problematic endpoints. From here, you can save it as a widget in a dashboard. For instance, converting it into a time-series chart lets you visualize spikes in 500 errors across the day, making it easy to spot patterns or sudden regressions after a deployment. Multiple widgets—such as error counts, latency distributions, and uptime checks—can be combined into a single dashboard to give your team a live view of application health.
For deeper guidance, Honeybadger maintains detailed documentation on Heroku integrations and Insights setup, which walk through querying, dashboards, and advanced configuration.
Like any integration, a few issues can arise. If no logs appear, double-check that you copied the correct Project API key and that the drain URL matches exactly. Running heroku drains -a APP_NAME will confirm whether the drain is attached. High-volume apps may also hit plan limits more quickly, so consider retention settings and log verbosity. And if the API key is ever exposed, rotate it in the Honeybadger dashboard and update the drain accordingly.
Honeybadger vs. general-purpose log services
| Feature | Honeybadger Insights | General log services |
|---|---|---|
| Log retention & search | Dynamic query language with aggregations, visualizations, and dashboards; retention scales with plan. | Full-text search with filters, long retention depending on provider |
| Error tracking | Built-in error monitoring with stack traces and context | Usually requires a separate error tracker |
| Uptime monitoring | Integrated uptime checks and alerts | Typically not included; separate service needed |
| Correlation of data | Logs, errors, and uptime events in one UI | Logs only; cross-tool correlation is manual |
| Ease of setup | Single Heroku drain + Project API key; optional env tag |
Drain setup required; add-on tools for errors/uptime |
By routing your Heroku logs into Honeybadger Insights, you not only improve log management but also gain a comprehensive monitoring solution. Logs, errors, and uptime events are correlated in one interface, reducing the need to jump between tools and helping you respond to incidents faster.
Advanced use cases & real-world scenarios
Heroku logs become truly powerful when applied to real-world troubleshooting and monitoring. Beyond day-to-day debugging, they can uncover subtle issues, reveal hidden bottlenecks, and provide insight into security events.
One of the most common advanced use cases is diagnosing dyno crashes. When a dyno repeatedly restarts, the system logs will capture the lifecycle events (“State changed from starting to crashed”), while the error logs provide the specific failure reason—such as an out-of-memory error or an unhandled exception in your code. Together, they tell the story of why your app keeps going down and what needs fixing. For example:
2025-08-22T12:32:11.012+00:00 heroku[web.1]: Process exited with status 137
2025-08-22T12:32:12.001+00:00 heroku[web.1]: State changed from starting to crashed
Another scenario is performance monitoring. While Heroku doesn’t provide built-in analytics, your logs still hold valuable clues. Router logs include latency and HTTP status codes, which make it possible to spot slow endpoints or an unusual number of 5xx responses. By correlating these entries with your application logs, you can quickly trace the source of performance degradation, whether it’s a database bottleneck or a code-level inefficiency. For instance:
2025-08-22T12:40:17.345+00:00 heroku[router]: at=info method=GET path="/reports" status=500 bytes=0 protocol=https connect=2ms service=2023ms
Logs are also a window into security anomalies. A spike in failed login attempts, repeated 404s on sensitive routes, or suspicious API usage patterns will all surface in your application and router logs. Even without a full security monitoring suite, attentive log analysis can help you catch brute force attempts or misuse before they escalate. Consider this sequence:
2025-08-22T12:45:03.120+00:00 app[web.1]: WARN: Failed login for user@example.com from IP 203.0.113.25
2025-08-22T12:45:04.212+00:00 app[web.1]: WARN: Failed login for user@example.com from IP 203.0.113.25
In more complex architectures such as multi-app or microservices setups, logs play an integrative role. When services communicate through APIs, aggregating logs across multiple Heroku apps provides a unified view of how requests travel through the system. This holistic perspective is critical for debugging distributed workflows where a failure in one service cascades into others. A correlated log stream might look like this:
2025-08-22T12:50:12.500+00:00 app[api-gateway]: TRACE: Request ID=abc123 forwarded to order-service
2025-08-22T12:50:12.678+00:00 app[order-service]: TRACE: Handling request ID=abc123 for /orders
2025-08-22T12:50:13.020+00:00 app[payment-service]: ERROR: Request ID=abc123 failed with timeout
When working across multiple services, correlation IDs are invaluable for end-to-end tracing. By assigning a unique request ID to every inbound call and propagating it downstream, related log entries can be stitched together later.
Python (FastAPI) middleware:
from fastapi import FastAPI, Request
from starlette.middleware.base import BaseHTTPMiddleware
import uuid, json, logging

logger = logging.getLogger("app")
app = FastAPI()

class RequestIDMiddleware(BaseHTTPMiddleware):
    async def dispatch(self, request: Request, call_next):
        rid = request.headers.get("X-Request-ID") or str(uuid.uuid4())
        request.state.request_id = rid
        response = await call_next(request)
        response.headers["X-Request-ID"] = rid
        logger.info(json.dumps({
            "level": "info", "msg": "request", "id": rid,
            "method": request.method, "path": request.url.path,
            "status": response.status_code,
        }))
        return response

app.add_middleware(RequestIDMiddleware)

@app.get("/reports")
async def reports(request: Request):
    logger.info(json.dumps({"msg": "reports-start", "id": request.state.request_id}))
    return {"ok": True}
Downstream services should copy the X-Request-ID header on outbound calls so the same ID appears everywhere (gateway → service → DB jobs → external APIs). This small discipline makes cross-app incident timelines trivial.
These scenarios demonstrate that Heroku logs are more than a temporary buffer—they are the frontline of observability, helping you bridge the gap between code and production reality. And when paired with a platform like Honeybadger Insights, these logs become even more actionable, providing search, filtering, and alerting features that turn raw entries into clear, production-ready insights.
Troubleshooting common logging issues
Even with a solid understanding of how Heroku logs work, developers often run into common issues that can be confusing at first. Fortunately, most of them have straightforward fixes once you know what to look for.
One of the most frequent problems is running heroku logs --tail and seeing nothing. This usually happens because the application’s dynos are scaled down to zero, meaning there’s no running process to generate output. Another possibility is that the command is targeting the wrong app—double-check you’re including the correct --app flag when tailing logs.
Another issue is missing application output, especially in Node.js or Python projects. The cause is almost always that logs are being written to local files instead of stdout or stderr. Heroku’s logging system only captures standard streams, so make sure your application uses console.log in Node.js or print/logging in Python, or better yet, a structured logger that writes to standard output.
If your app generates a very high volume of logs on Cedar-generation apps, you may notice entries disappearing from the 1,500-line buffer before you have a chance to read them. On Fir-generation apps, there's no buffer at all—only real-time streaming. In both cases, the fix is to forward logs to an external drain, where they can be retained, searched, and analyzed over the long term.
Finally, logs can sometimes be lost during application crashes if they aren’t flushed properly. Using a mature logging library—such as Winston or Pino for Node.js, or Loguru for Python—helps ensure that log entries are written out immediately and aren’t left stranded in memory.
Understanding these pitfalls and how to resolve them can save you valuable debugging time and keep your logging workflow reliable.
Moving from reactive debugging to proactive observability
Heroku logs are the lifeline of applications running on the platform. They provide visibility into everything from dyno restarts to API releases to application-level errors, making them the first place you should look when something goes wrong. Whether you access them through the CLI (heroku logs, heroku logs --tail) or the dashboard, they are indispensable for debugging and monitoring day-to-day issues.
That said, Heroku’s built-in logging comes with limitations: short retention, no filtering, and no built-in analytics. For teams running production workloads, these restrictions make external log forwarding essential. By connecting your app to a service like Honeybadger Insights, you extend Heroku’s capabilities with centralized log management, powerful search, integrated error tracking, and uptime monitoring.
In short, Heroku logs get you started, but Honeybadger helps you complete the picture — moving you from reactive debugging to proactive observability. Start a free trial today and see how much smoother your Heroku logging workflow can be.

Written by
Farhan Hasin ChowdhurySoftware developer with a knack for learning new things and writing about them.