Datadog alternatives: which observability platform fits your needs?
If you've ever responded to a late-night service outage, then you know how important it is to have the right tooling to get everything back up and running. Platforms like Datadog handle monitoring along with data collection and analysis across all kinds of vectors, spanning infrastructure monitoring, network performance, and security compliance. The insights Datadog provides enable actionable improvements to your technical architecture, resulting in satisfied customers and better business outcomes.
While Datadog is one of the dominant players in the observability space, that doesn't mean it's the right solution for every scenario. If you're looking for a Datadog alternative — or simply exploring other options — then this article is for you.
Why look for a Datadog alternative?
The most common pain point users bring up with Datadog is its billing. Datadog's billing is complex, with charges broken down into multiple areas, making costs hard to manage and predict. Many users report spending more than their initial estimates.
Support isn't cheap either. Premium support adds 8% to your monthly bill, with a $2,000 monthly minimum. Some users also complain about vendor lock-in, while others struggle with Datadog's steep learning curve.
These issues lead many users to consider alternatives. In this article, we'll take a look at some of Datadog's top competitors and what to consider when evaluating a new tool.
Datadog alternatives at a glance
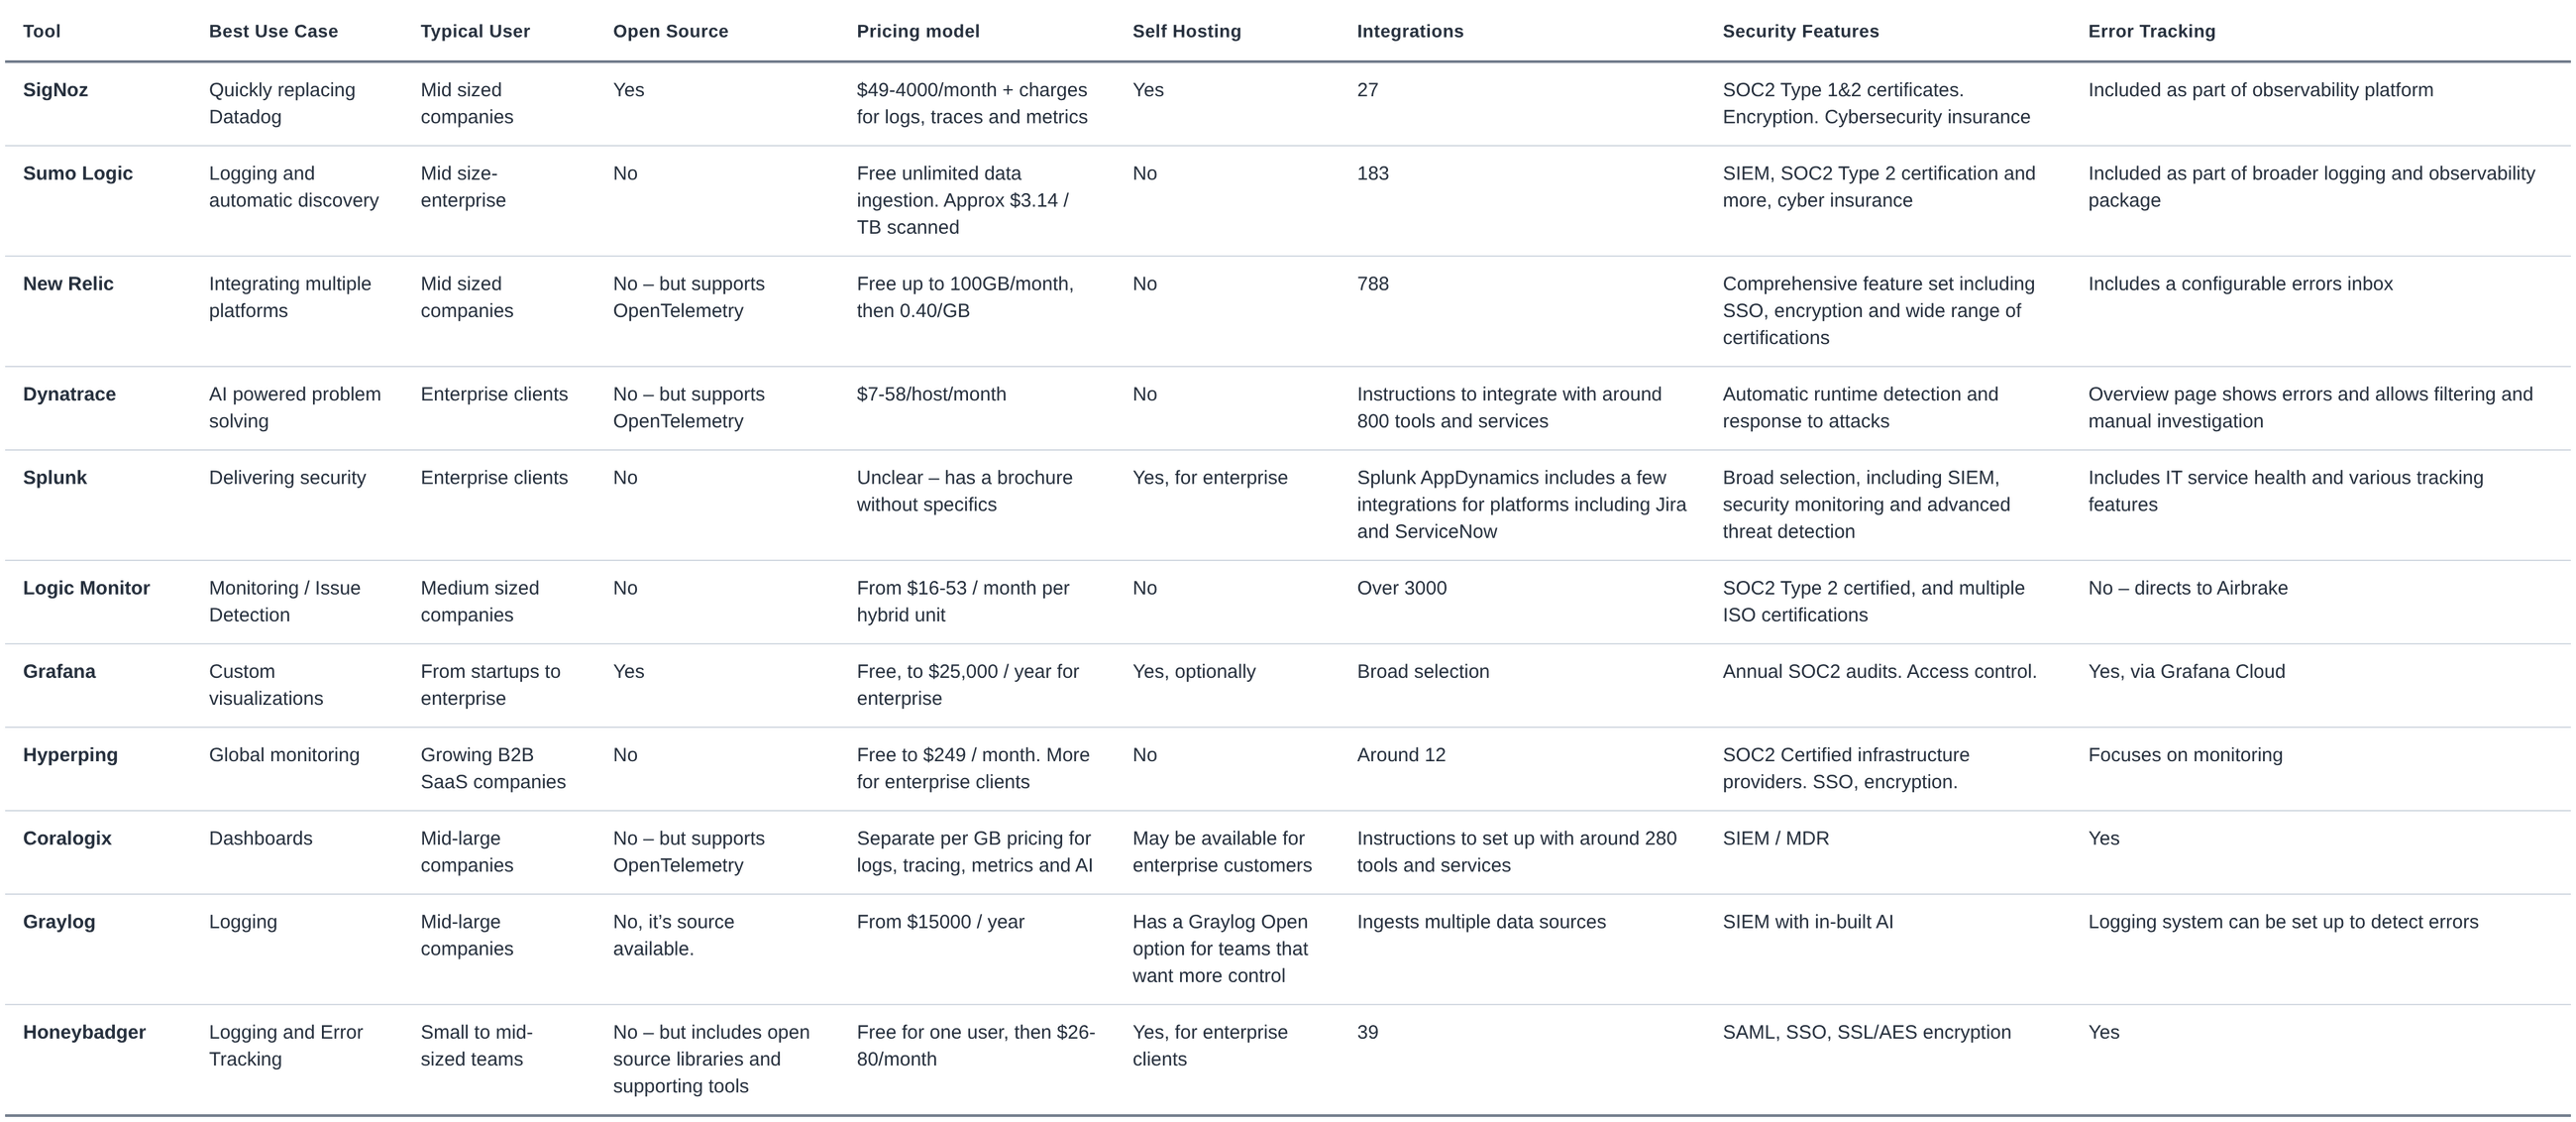
A more in-depth look at the competitors
Some of the platforms we'll explore take a comprehensive approach, while others are more specialized. To help guide you to the right tool, here are our ten favorites, each chosen for a specific use case.
Best drop-in Datadog replacement — SigNoz
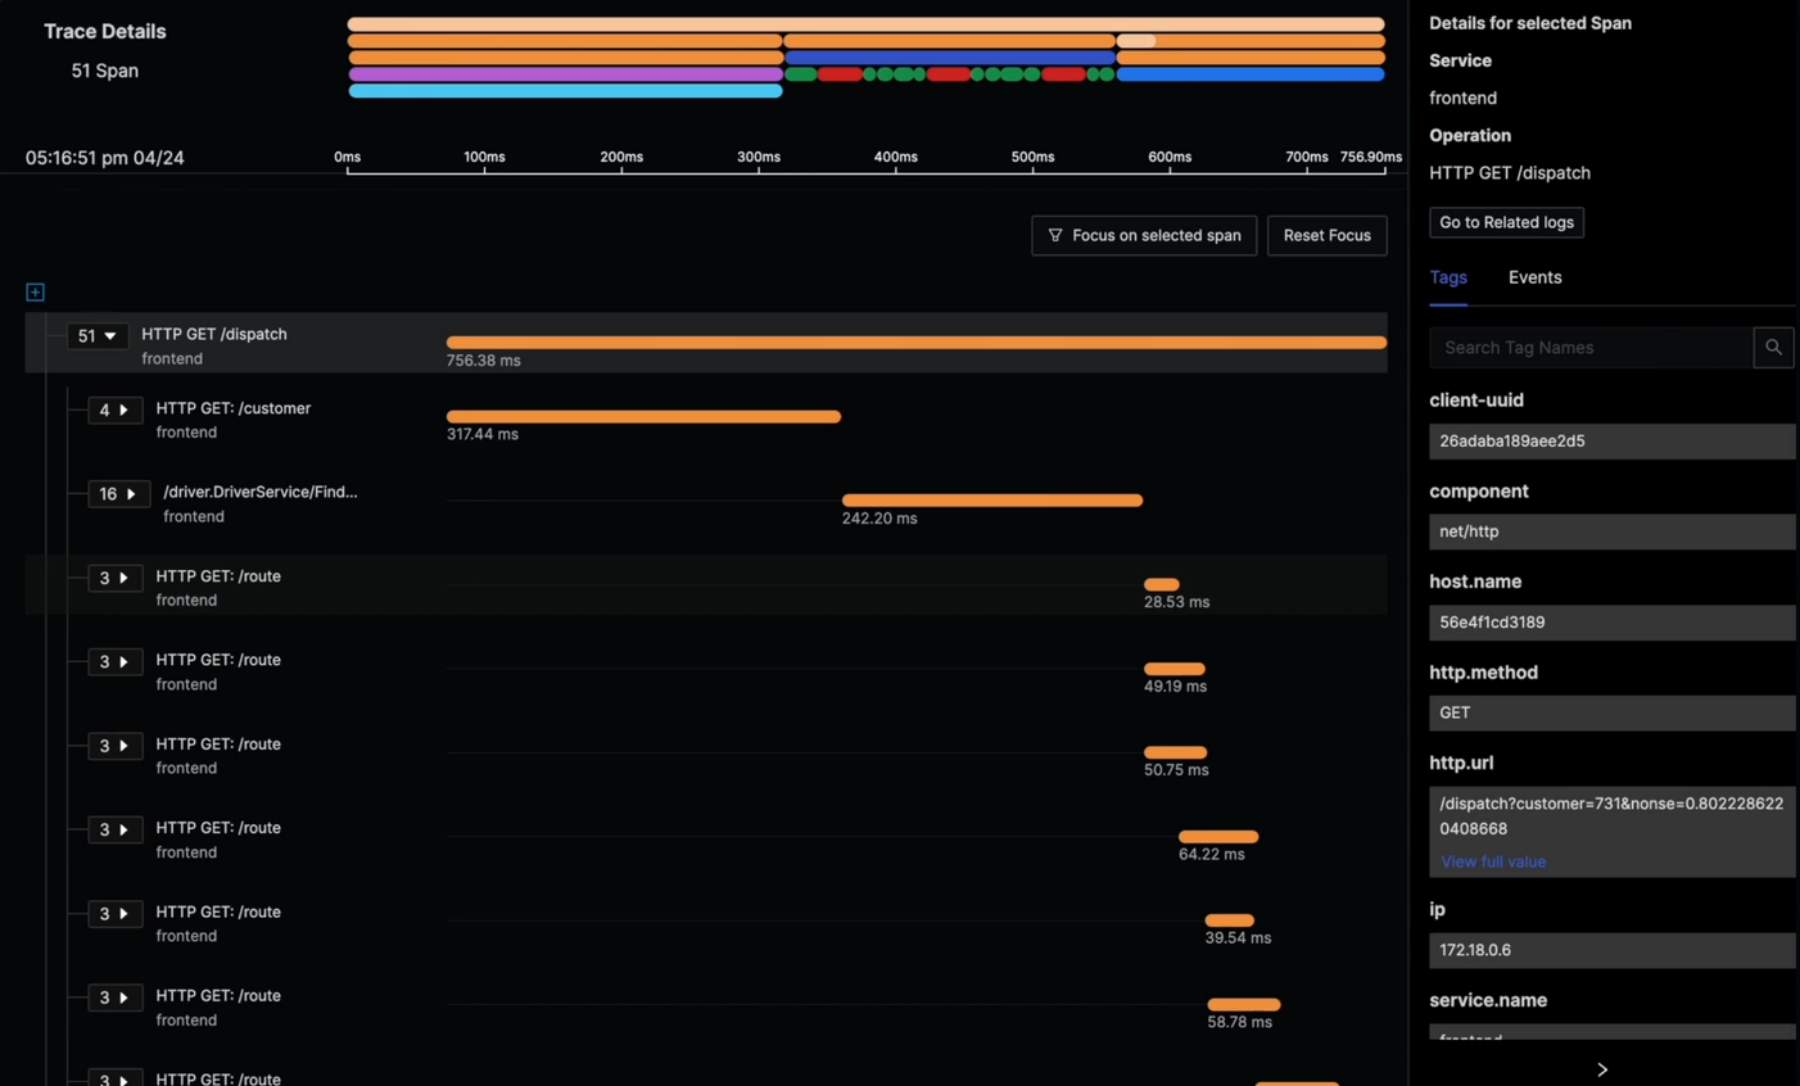 SigNoz offers a range of metrics. This screenshot shows network latency data.
SigNoz bills itself as an open-source Datadog alternative, making it an excellent choice for those looking to directly replicate Datadog's functionality.
Built on top of OpenTelemetry, SigNoz is open source, which makes it easy to customize and free to self-host — you pay only for storage and compute. SigNoz Cloud's usage-based pricing starts at $0.30/GB for logs and traces and $0.10 per million samples for metrics, making the tool significantly cheaper than enterprise alternatives at scale. Using SigNoz also means you avoid vendor lock-in.
SigNoz keeps your metrics in one place and automatically correlates them for faster incident response. With help from its clear user guides, most teams have their first SigNoz dashboard up in an hour. Once running, you have a convenient UI offering a unified view across your systems. With 27,000 GitHub stars, SigNoz has earned strong adoption among fans of open-source tools and developers prioritizing flexibility and cost control.
Best for log management — Sumo Logic
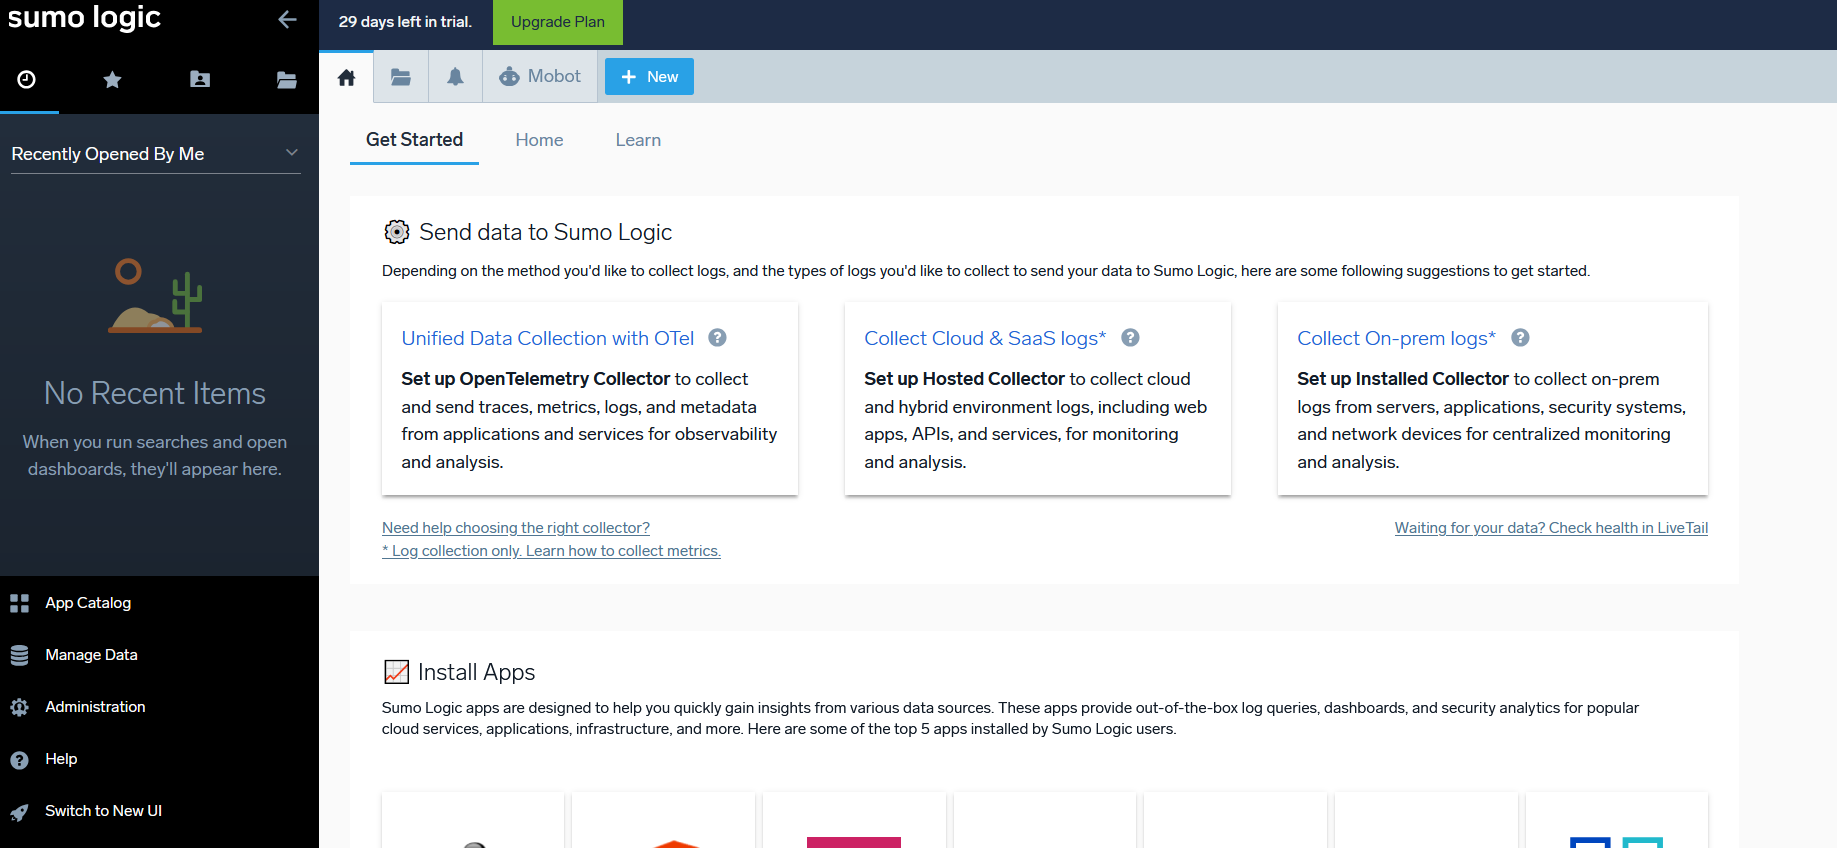 Sumo Logic makes it easy to ingest data from virtually any source.
Sumo Logic is an outstanding logging tool built on an AI-driven security analysis and response platform. The platform automates discovery, letting it quickly build a picture of your network infrastructure. In addition to infrastructure monitoring, it excels at threat detection through anomaly detection.
Pricing is relatively straightforward: unlimited users, free data ingestion, and roughly $3.14 per TB scanned (contact sales for specifics). The platform tends to be used by mid-size to enterprise-level companies.
Beyond functionality, Sumo Logic brings personality to the table with its Robot Sumo mascot and a comfortable, intuitive UI that's genuinely pleasant to navigate. It's a great tool for helping protect your network infrastructure, particularly if logging and data collection are important to you.
Best for teams needing to integrate multiple platforms — New Relic
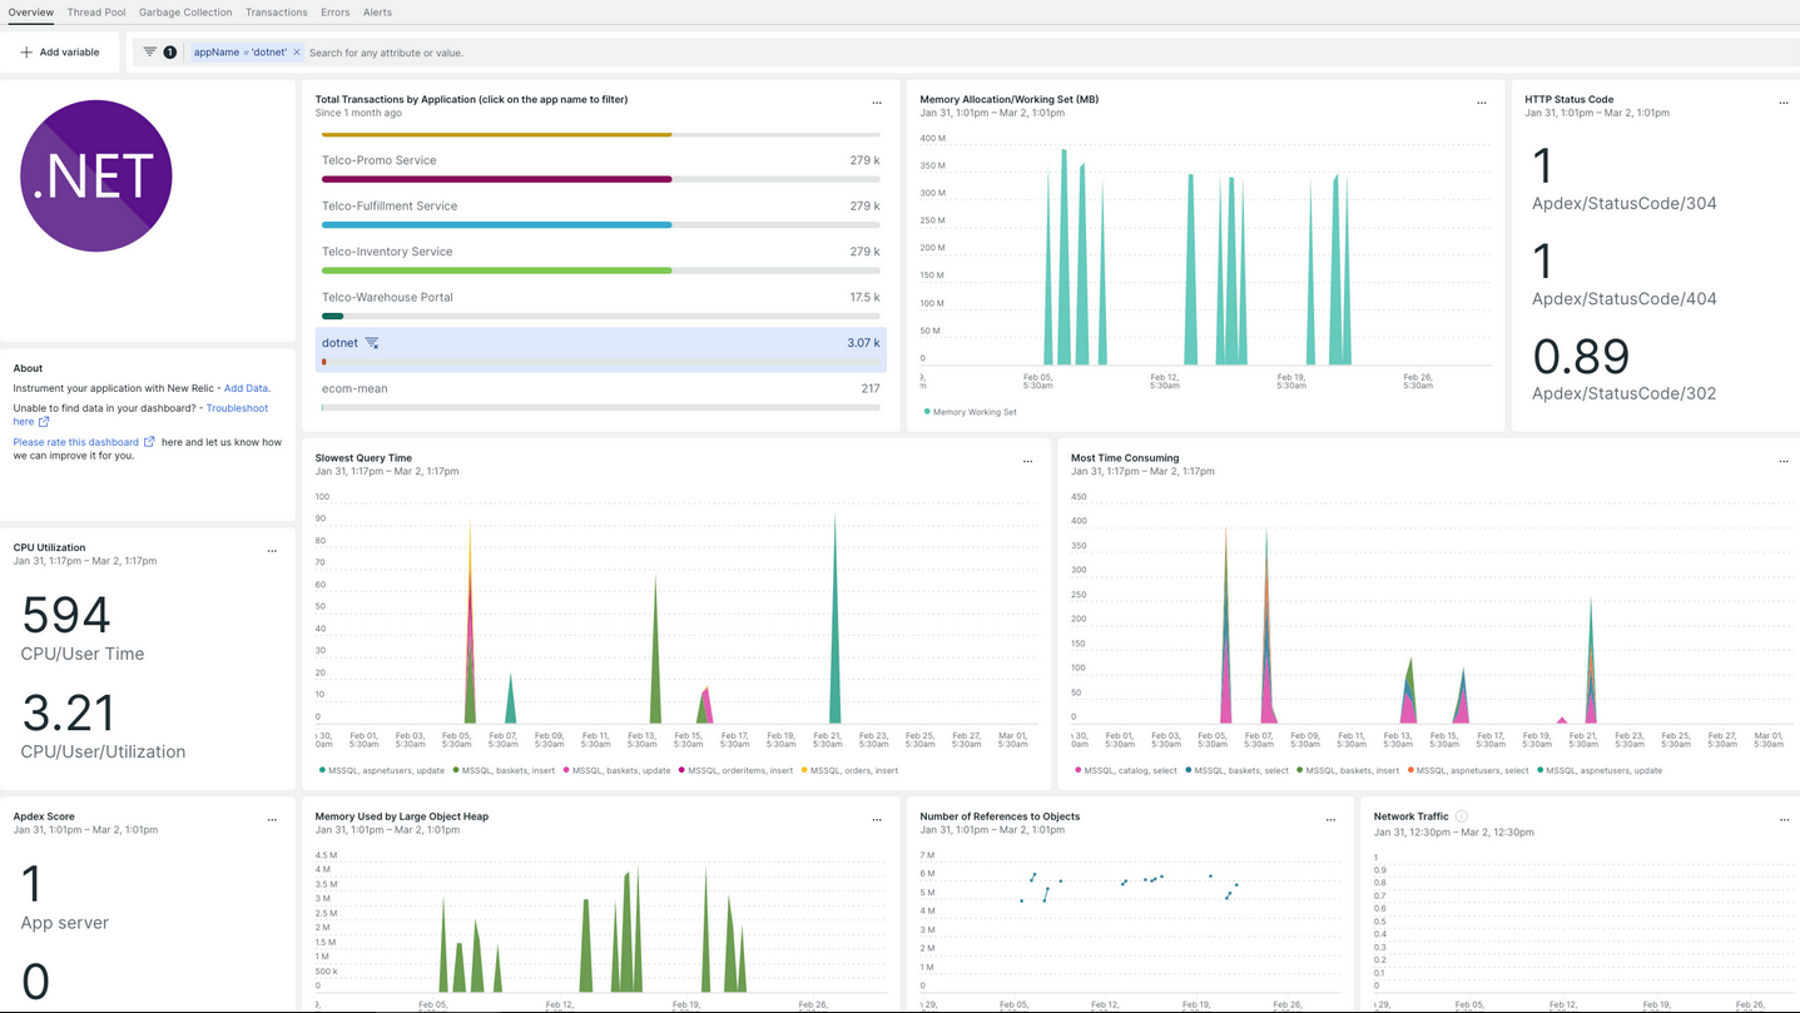 New Relic offers complex metrics allowing for deep infrastructure analysis.
New Relic offers observability with intelligent automation. Similar to competitors like Datadog, New Relic provides comprehensive coverage across APM, monitoring, metrics, and logging. The platform covers many bases in a single tool, complete with extensive dashboard templates and setup guidance.
New Relic is easy to sign up for and get started with. The interface is intuitive and full of helpful resources, though some users find the sheer volume of information overwhelming. Some users also mention pricing complexity, so if that's why you're leaving Datadog, New Relic might not be the best alternative.
It's free up to 100 GB/month and then costs $0.40/GB ($0.45/GB outside the US). Features like single sign-on and HIPAA compliance are available at higher tiers.
New Relic's ability to cover multiple tools and its range of integrations make it a good pick for growing mid-size companies where infrastructure management is becoming more challenging.
Best for enterprise AI root cause analysis at scale — Dynatrace
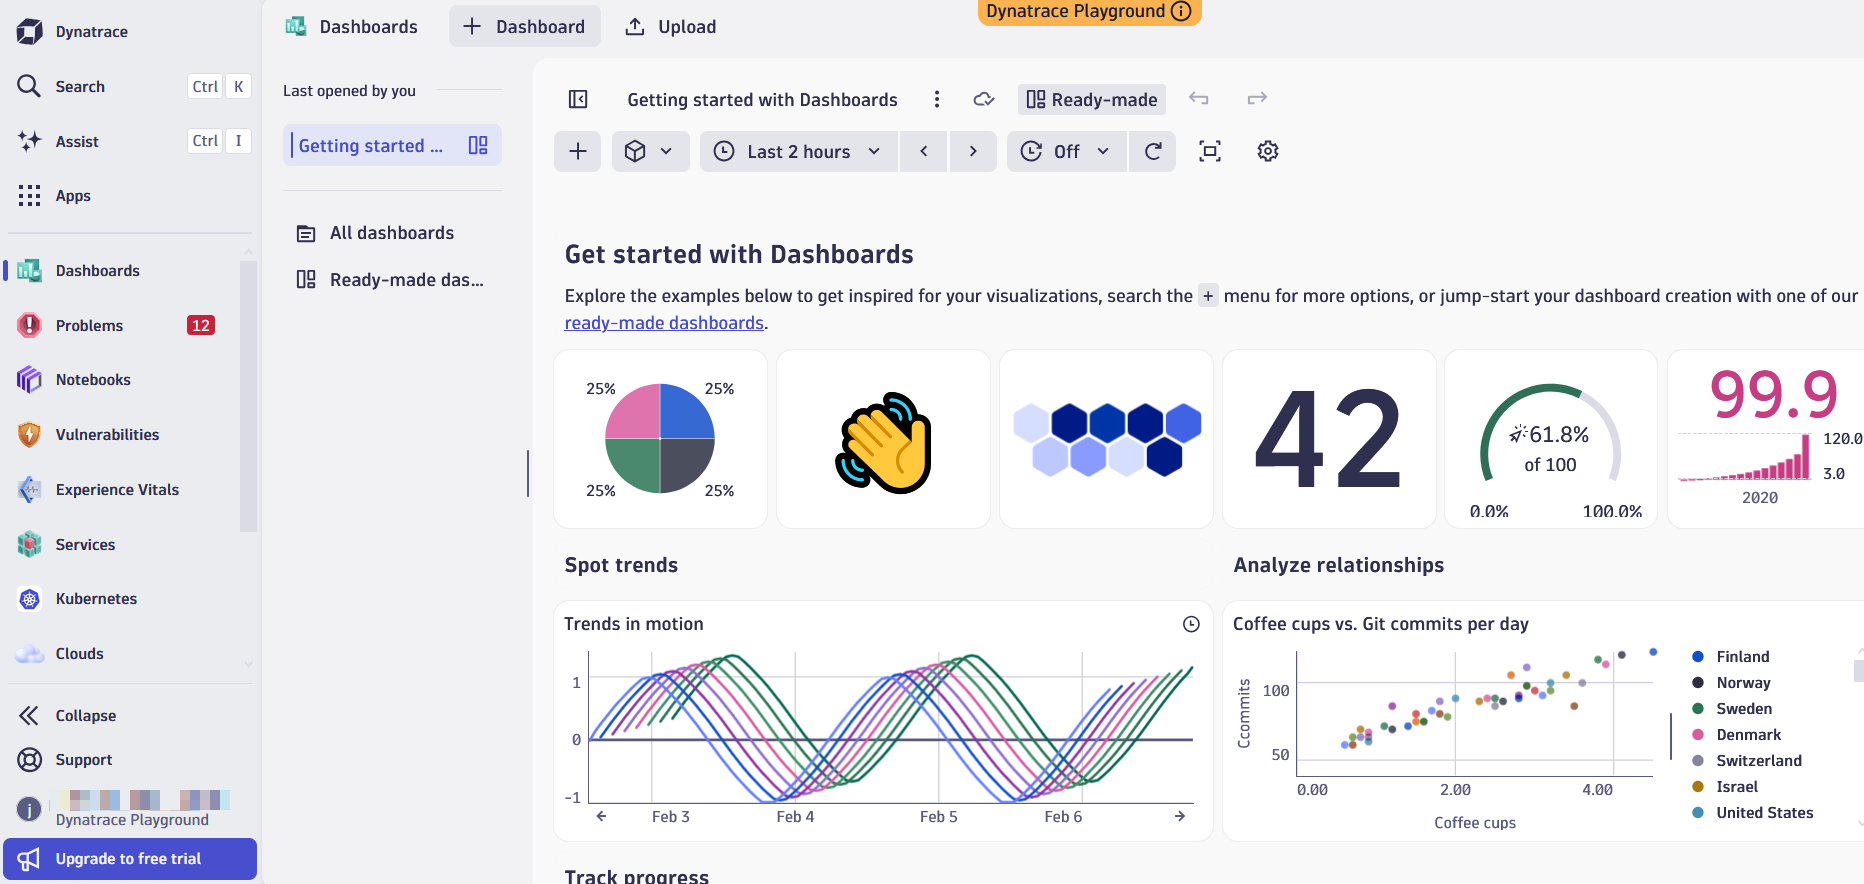 Dynatrace has plenty of ready-made dashboards to get started with.
Dynatrace centralizes observability, security, and business data in a single dashboard, letting you control your systems from one place. Dynatrace pushes its Dynatrace Intelligence AI as a core feature, with benefits including automated problem detection and workflow automation. It also includes Grail, which Dynatrace describes as a "unified data lakehouse," letting you collate your observability data alongside security and business data.
The billing model is transparent and manageable, though many customers find the platform expensive at enterprise scale. Dynatrace suits large, complex organizations where cost is less of a concern than capability. The platform also includes a useful playground where engineering teams can test it out before buying.
Best for enterprises prioritizing security — Splunk
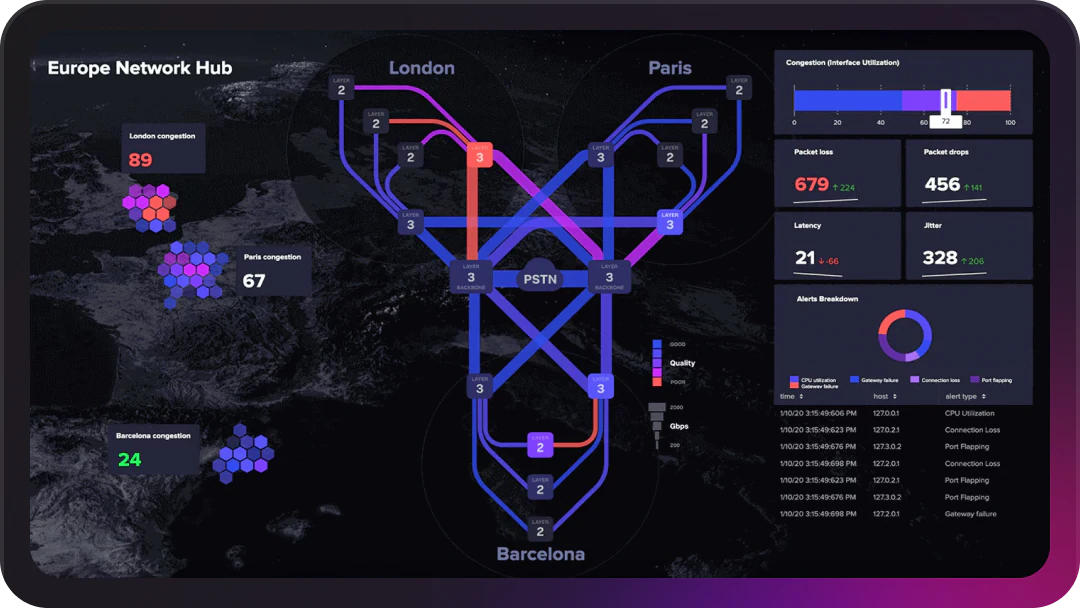 Splunk lets you analyze how widely distributed network infrastructure interacts.
Splunk is all about security and observability at enterprise scale. The platform offers advanced threat detection, AI-based incident prediction, APM, and automated compliance monitoring. With strong security analytics and transaction visibility, it's a strong choice if compliance and fraud prevention are priorities.
With over 2,000 integrations, Splunk connects seamlessly with most SaaS tools. Splunk is now part of Cisco, so it has enterprise-grade backing. The Splunk Observability Cloud provides application performance monitoring and comprehensive infrastructure visibility, enabling continuous monitoring of your network health.
Splunk doesn't have the same range of pre-built templates that Datadog has, so it can be slower to get started with and requires some manual setup. Other potential downsides include its complexity and price. Plans start at $15 per host per month. However, if security is your priority, Splunk delivers exceptional value.
Best for customer support — LogicMonitor
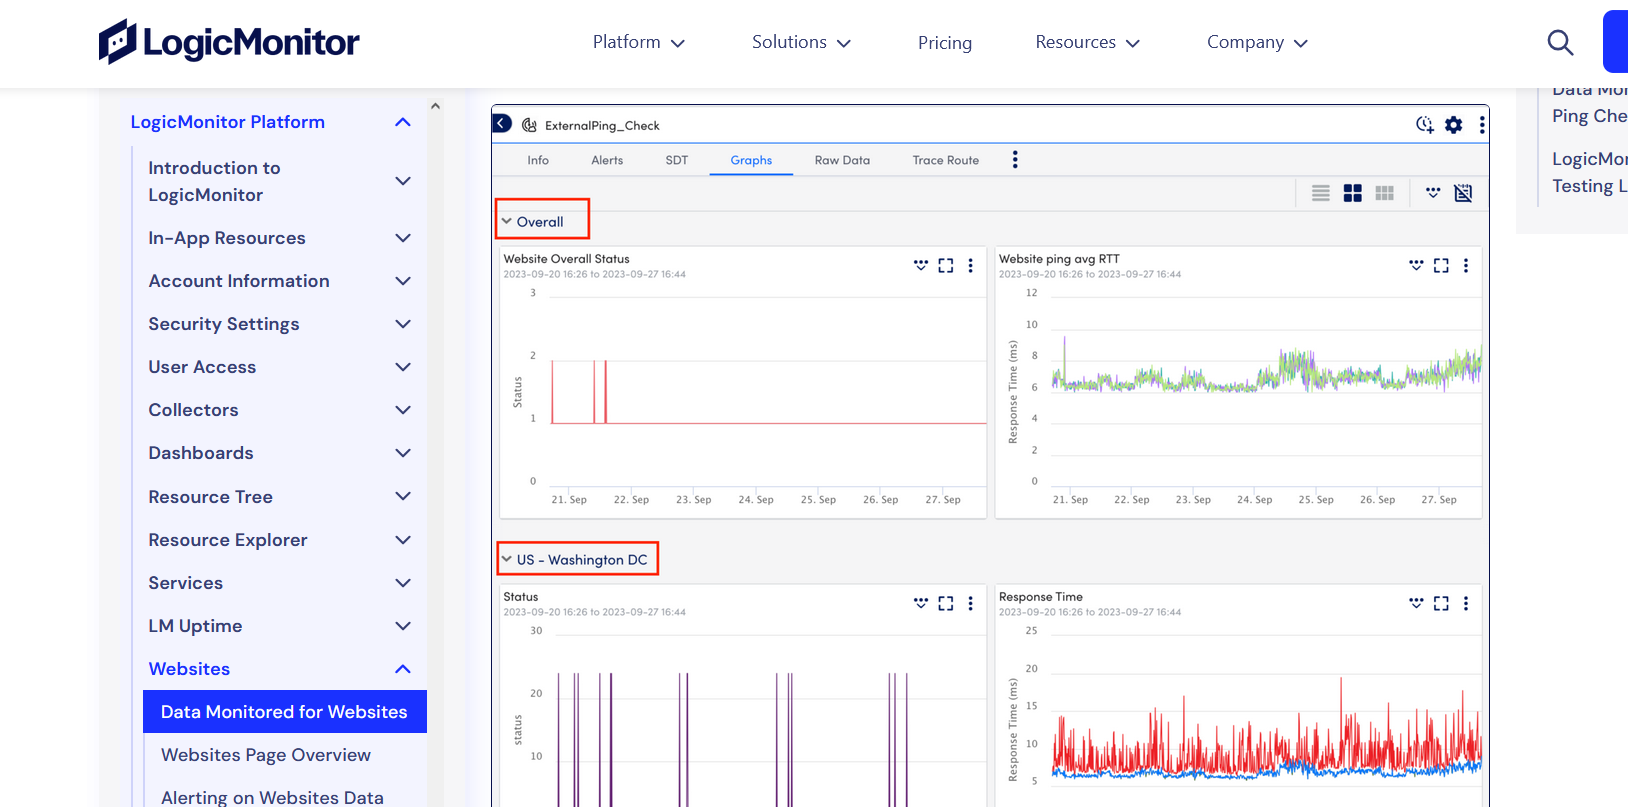 LogicMonitor offers many stats — here we see various metrics relating to website responsiveness.
LogicMonitor excels at monitoring across networks, servers, containers, and cloud platforms. The platform includes digital experience monitoring to make sure that, in addition to collecting metrics, you can translate them into improvements for your customers.
LogicMonitor's Edwin AI is designed to reduce IT Service Management (ITSM) incidents and help filter out the noise, letting you make informed choices. Its customer support is also highly praised.
Best for customizable dashboards — Grafana
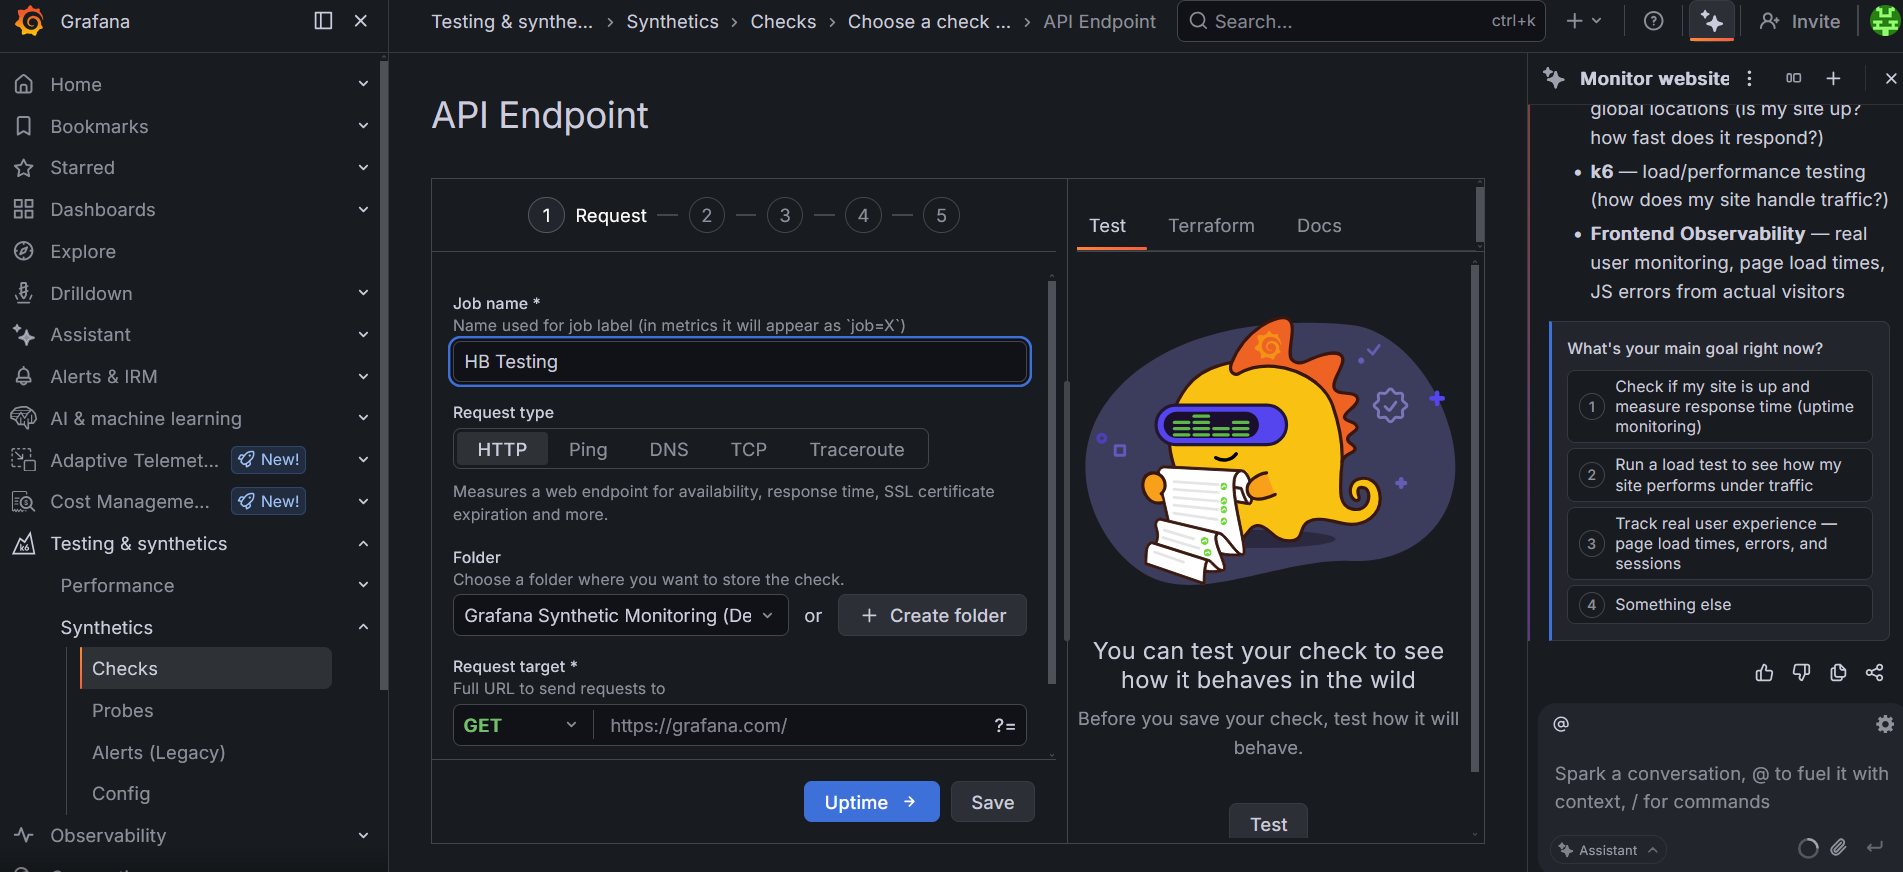 Grafana lets you easily set up endpoint tests.
Grafana delivers versatile observability that excels at infrastructure monitoring. Highly customizable, it shines at custom metrics and dashboards, and integrates deeply with tools like Prometheus, which it's often paired with.
Grafana Cloud adds adaptive telemetry that aggregates less useful data, cutting costs significantly. If you're running Kubernetes clusters, you'll find it's also good at container monitoring and integrates seamlessly with cloud services like Amazon CloudWatch.
Grafana's versatility extends to its pricing: the free tier is suitable for personal projects, the Pro plan is inexpensive, and enterprise plans start at $25,000 per year.
Getting started is easy, making Grafana an excellent choice for teams looking to build a tailored observability solution — especially if Kubernetes is involved.
Best for simple uptime monitoring with a global focus — Hyperping
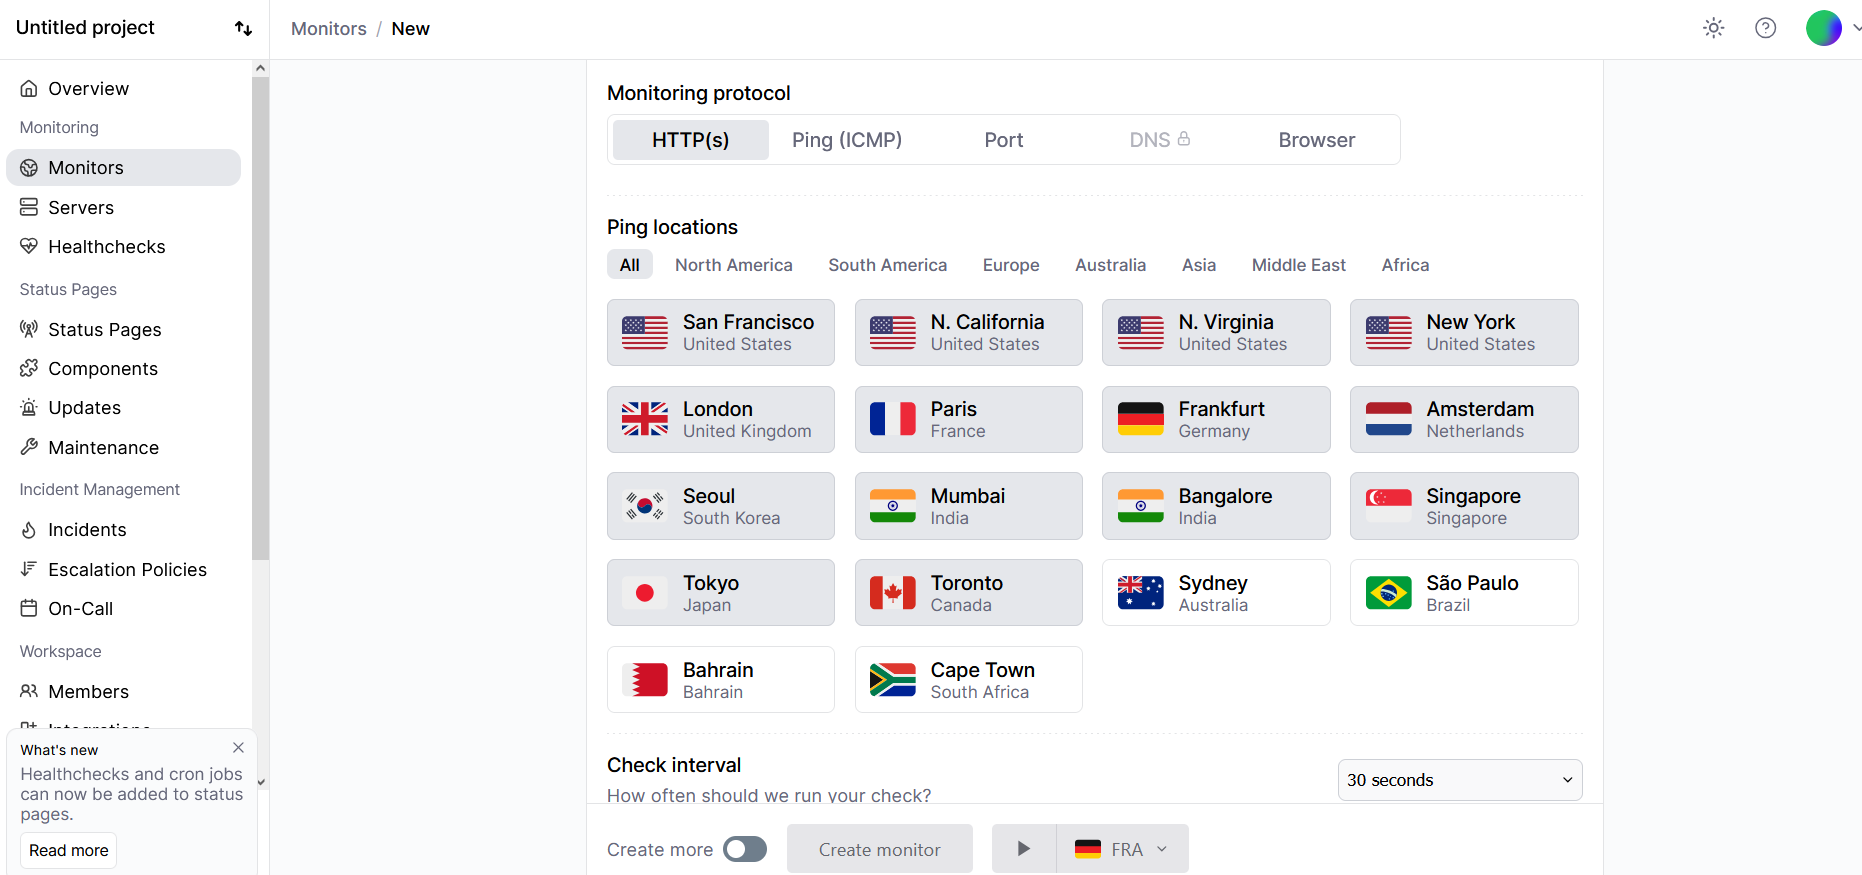 Hyperping is easy to set up with servers around the world.
Hyperping is a no-nonsense uptime monitoring service that stays out of your way and keeps things simple. It monitors your site from locations all around the world and alerts you to problems before they impact your customers.
Beyond uptime monitoring, Hyperping handles server and cron monitoring, incident management, browser checks, and status pages.
The Hyperping Free plan includes 20 monitors. The Premium plan ($249/month) unlocks 1,000 monitors, up to 15 users, and extras like priority support, white labeling, IP filtering, and SAML SSO. If that interests you, it's easy to sign up and explore its features.
Best for startups on a budget — Coralogix
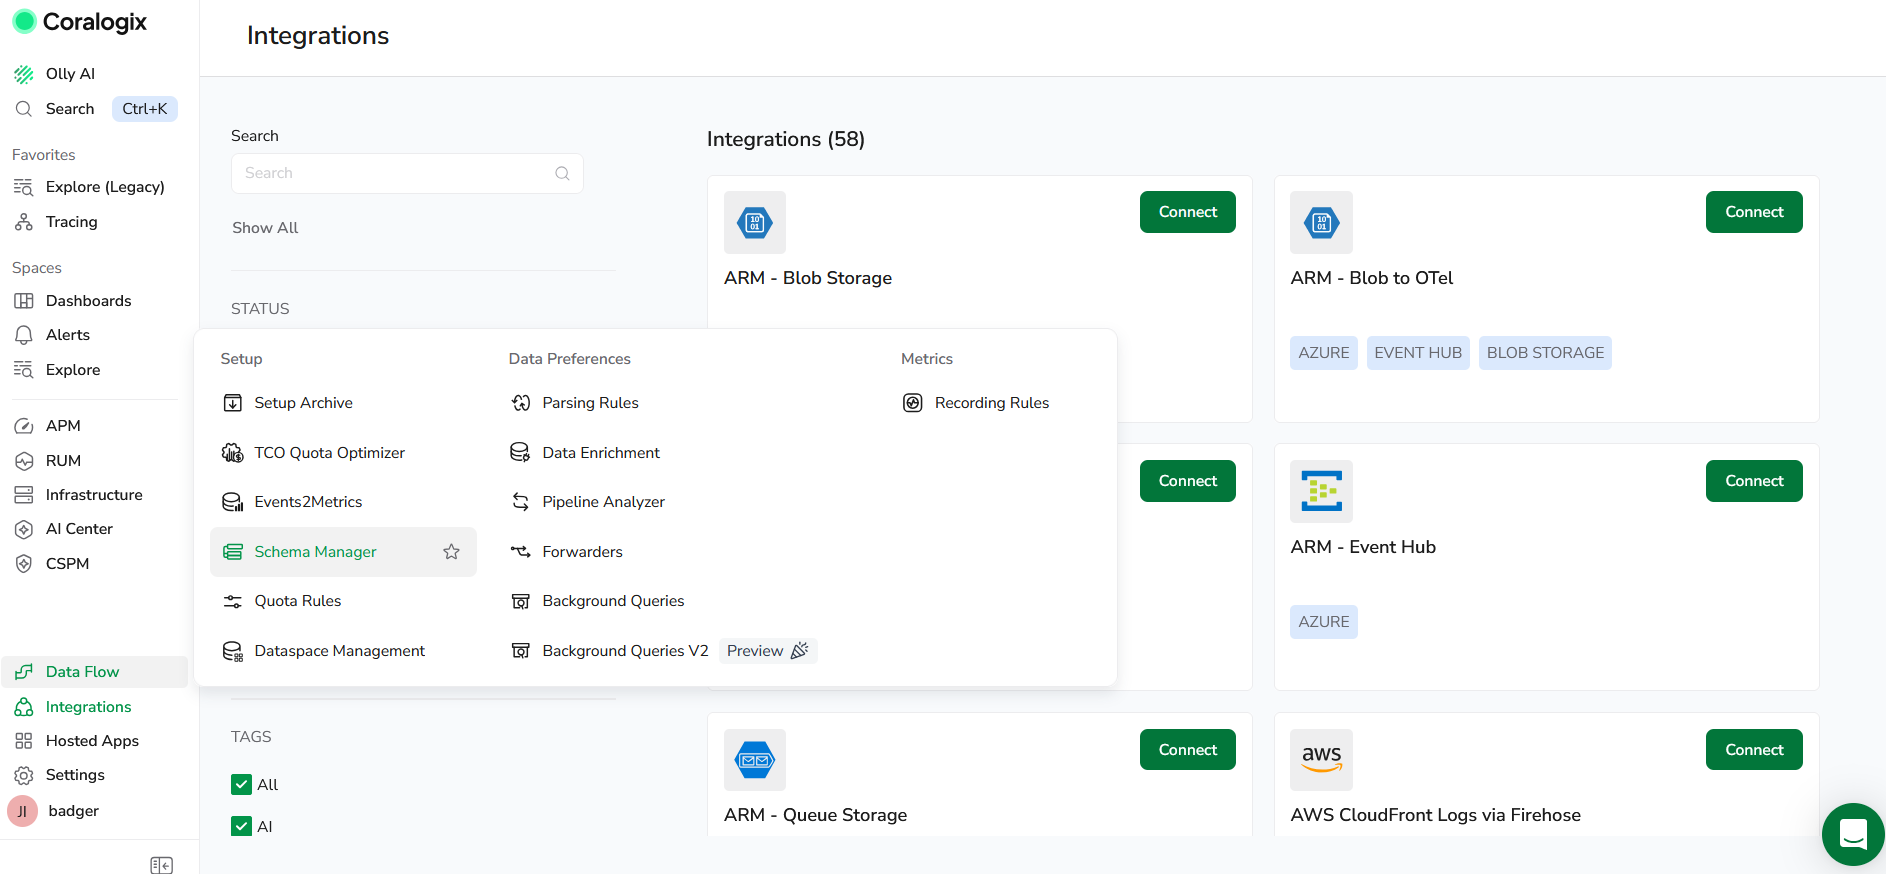 Coralogix has a host of integrations available from its UI.
Coralogix positions itself as a truly AI-native platform, combining long-term data retention with machine learning to monitor more efficiently while also reducing costs. The platform's Streama system filters and reduces data at ingestion, dramatically lowering storage costs. It also includes compliance reporting.
Coralogix offers comprehensive monitoring across your entire tech stack. Its cost efficiency and AI assistance make it a great choice for smaller companies looking to get started with a monitoring solution that can grow with them.
Coralogix has over 4,000 customers, including Adobe and Nando's. Signing up is quick and easy, and the 14-day trial lets you explore its interface before committing.
Best for compliance and auditing — Graylog
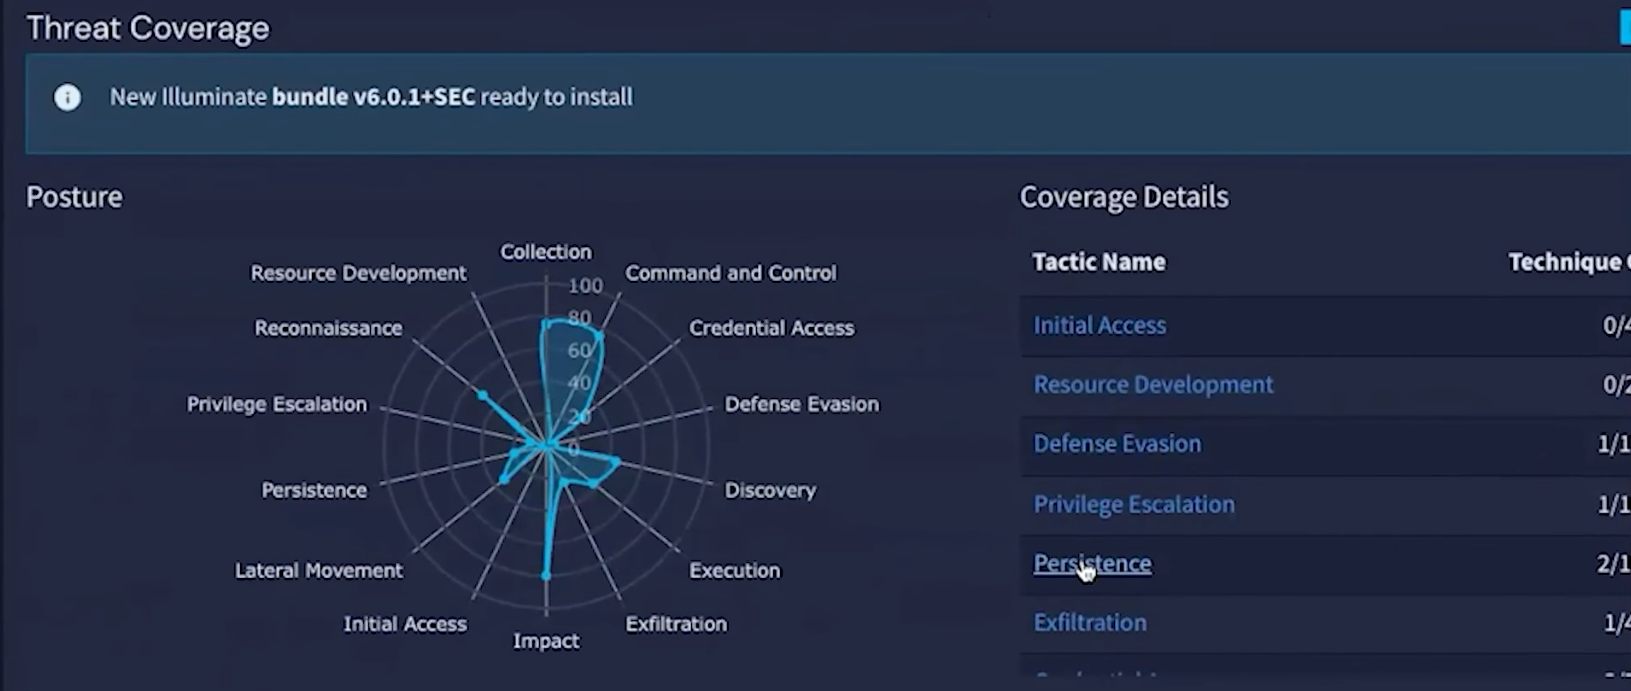 Graylog lets you analyze threats in detail.
Graylog delivers AI-powered SecOps and log management. With its focus on logging and security, Graylog is ideal for teams looking to maximize their accountability and create a complete audit trail of their activities.
Starting at $15,000 per year, Graylog represents a significant investment, but it provides a full set of security and compliance features. The platform offers three different packages: one focused on alerting and maximizing uptime, one based on security, and another targeting API security specifically.
Organizations in compliance-heavy industries (financial services, healthcare, and regulated tech) should take a serious look at Graylog.
Honeybadger: the best Datadog alternative for error tracking
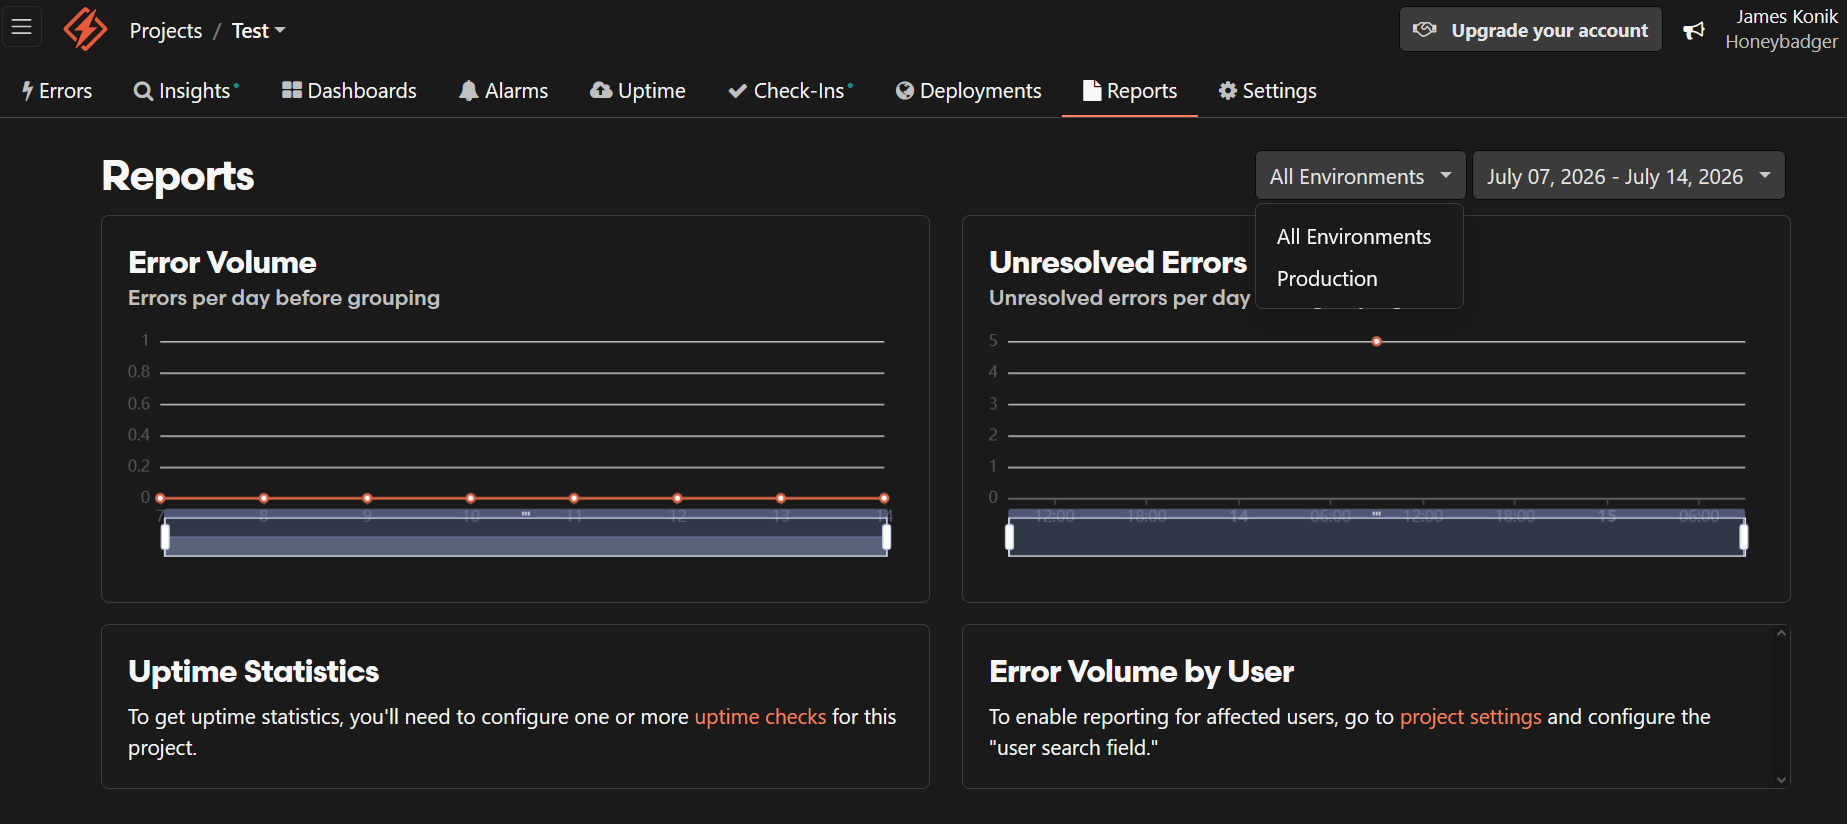 Honeybadger makes it easy to keep tabs on errors.
Finally, we come to Honeybadger. We admit we're biased here, but we think it belongs on the list.
Honeybadger lets you identify and respond to errors fast. You can set up workflows to deliver fixes and solve problems before your customers ever notice them.
Honeybadger is easy to customize. Alerts are flexible, and you can report custom errors from your own code alongside the errors Honeybadger catches automatically. It's quick to set up, and you can create status pages to keep your customers informed during an incident. While error tracking is the core product, Honeybadger also offers logging, uptime monitoring, and lightweight performance dashboards — meaning you can find and fix backend errors without wading through an enterprise platform.
Pricing is transparent and competitive across three tiers: the Free tier is remarkably capable for solo developers, the Team plan ($286/year) adds unlimited users, and the Business plan ($880/year) unlocks advanced workflows and extra security features. Both paid plans cost significantly less than Datadog and most alternatives.
Honeybadger is the best choice for smaller teams that want focused error tracking and a quick setup. If you're keeping Datadog for infrastructure, Honeybadger's Datadog integration sends errors directly into your existing setup so you can consolidate visibility without switching platforms.
How to choose the best Datadog alternative for your goals
Datadog excels at many tasks, so selecting a replacement means finding a tool that matches its performance in the areas that matter most to your organization:
Price and billing transparency. You need a bottom line that works for you. If you can't work with or understand Datadog's pricing structure, look for alternatives that offer predictable pricing and potentially lower monitoring costs.
The right functionality. Look for the features you actually need. What level of security is required? Are logging and error tracking enough, or is user management also important? A tool that does precisely what you need — and does it exceptionally well — is the wisest choice.
Scalability and growth. Startups, mid-size SaaS companies, and enterprises all have different needs. If you're hoping to grow, choose a tool that can grow with you. The key is to understand how your business could evolve and to factor that into your tooling decisions.
Usability. Is the product a good match for your team's skills? A powerful but complex platform requires technical expertise or significant onboarding time. Don't get locked into a solution that creates more friction for your team.
What does your team actually need?
Datadog dominates the market because it offers genuine value to teams needing observability for their cloud platforms. Its advanced feature set makes it a top choice for many organizations.
But Datadog's pain points are real: notably unpredictable billing, costly support, and vendor lock-in. Fortunately, there are other choices available.
The tools on this list each excel in different areas, so it's critical to understand the needs of your team and choose accordingly. You don't need the most powerful tool — you just need the right tool.
If error tracking is your thing, we'd humbly suggest you try Honeybadger. It's affordable, easy to use, and laser-focused on making error tracking effective. Sign up for a free trial of Honeybadger to see for yourself how good it is.

Written by
James KonikUncertain if he's a coder who writes or a writer who codes, James tries to funnel as much of this existential tension as possible into both of his crafts. When he occasionally hops out from behind his keyboard, you can find him jogging and cycling around suburban Japan.