 By
By Working with Logs in Ruby
Logging is one of the primary tasks an application usually addresses. Logs are used when you need to, for example,
- see what’s happening inside of your apps,
- monitor them, or
- collect metrics for some specific data.
When learning a new programming language, the first obvious pick to log information is the native mechanism. It is usually easy, documented, and well-spread throughout the community.
Log data varies a lot depending on the company, business, and type of application you’re working with. Therefore, it’s very important to understand how the logging solution you and your team chose will impact its overall use.
In this article, we’ll take a ride through the available options of logging for Ruby and Rails, from the built-in ones to the beloved third-party community frameworks. Let’s go!
Ruby's Built-In Options
Ruby comes with two built-in options to handle logging: printing commands (specially designed for command-line scenarios) and the Logger class.
Let’s explore them a little bit.
Printing to the Console
Ruby has four common ways to print text to the console: puts, print, p, and pp.
The puts method prints anything you pass to it, followed by a new line:
2.7.0 :001 > puts "Hey, I'm a log!"
Hey, I'm a log!
 => nil
The print method is similar to puts, however it always converts arguments to strings using the to_s method.
Finally, the p and pp methods will both print the raw object you’re passing to them without performing conversions; the only difference is that the latter formats the output in a more indented way, while the former does not.
Application Logs
For applications running on servers, it doesn't make sense to print to console.
Instead, we use the Logger class, which is much more flexible.
Here's how you might use it to print a "debug" log:
require "logger"
logger = Logger.new(STDOUT)
logger.debug("I'm a debug log")
We could also configure it to store the logs to a file, or send them to a log aggregator instead of printing to STDOUT if we wanted to.
In case you're wondering, "debug" is a log level. Log levels let you tell the system "this log message is related to a certain kind of event." There are six built-in log levels: Fatal, Error, Warn, Info, Debug and Unknown.
logger.debug("I'm a debug log")
logger.info("I'm an info log")
logger.warn("I'm a warn log")
logger.error("I'm an error log: error message")
logger.fatal("I'm a fatal log")
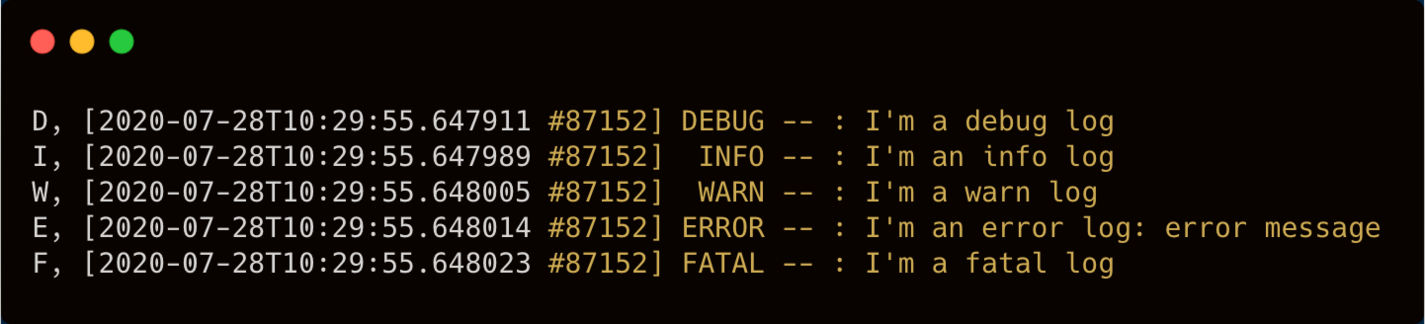
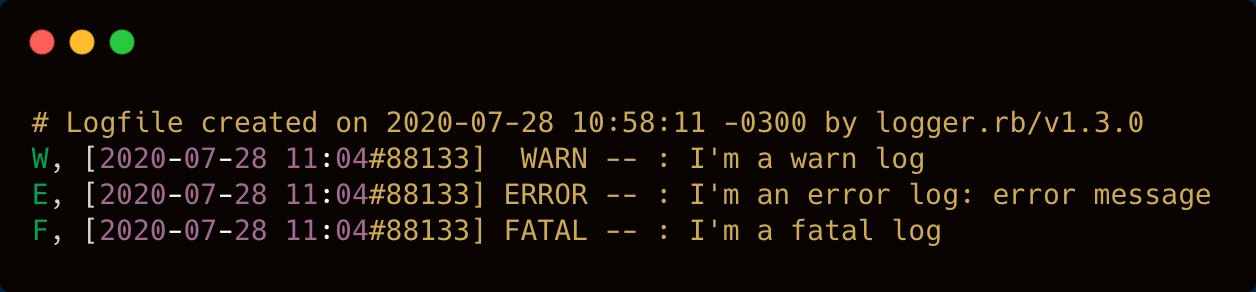
When we look at the log output, we see that the log level, process id and timestamp have been appended to each line:
Another great feature is the ability to set your Logger object at a specific level:
logger.level = Logger::WARN
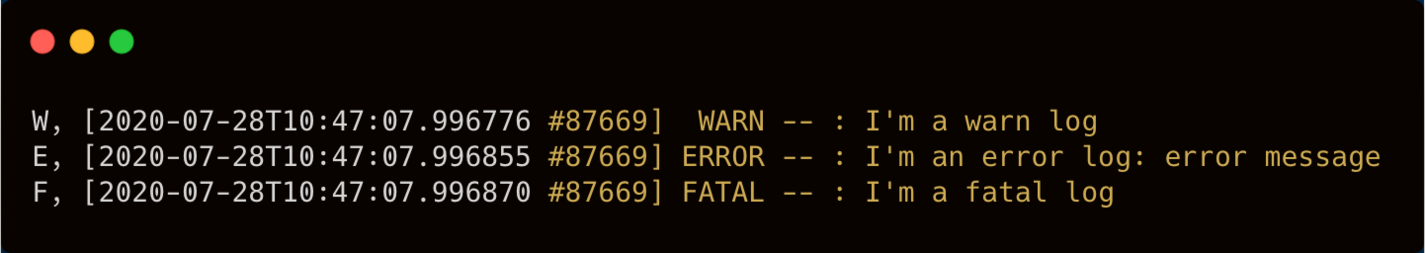
When you do this, Logger will only handle the logs equal or higher to warn in importance. This is very useful in production, where we may not want to save "debug" logs due to size or security reasons.
This should be the output:
Customizing Your Logs
If you want to customize your logs, there’s plenty of options. To change the date and time, for example, just overwrite the default one:
logger.datetime_format = "%Y-%m-%d %H:%M"
Here’s an example of the output:
W, [2020-07-28 10:50#87786] WARN -- : I'm a warn log
The date_time format follows the standard specification, so be sure to refer to it when performing such changes.
Sometimes, however, you may need to fully modify the format of your logs. For this purpose, Ruby provides the Formatter class. It works by allowing devs to overwrite the default template that Logger uses to print logs.
Imagine that your app makes use of a centralized logs analysis tool and needs all of your logs to be printed in the name=value format. This would be the new formatter code:
logger.formatter = proc do |severity, datetime, progname, msg|
    date_format = datetime.strftime("%Y-%m-%d %H:%M:%S")
    "date=[#{date_format}] severity=#{severity.ljust(5)} pid=##{Process.pid} message='#{msg}'\n"
end
Here, we’re making use of a proc to intercept all the logs and change the default way they're printed to the desired one. Now, we have the following result:
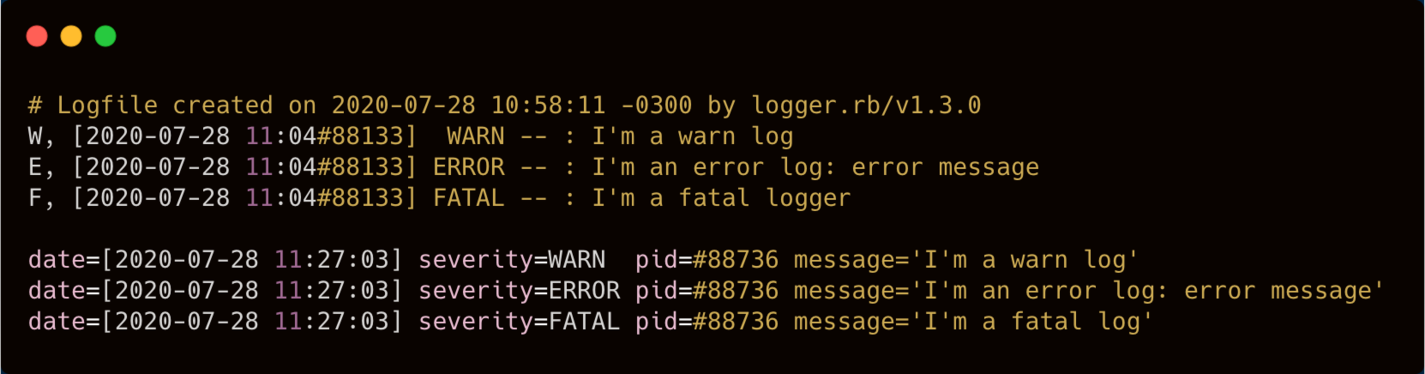
With just a few lines of code, all of your app logs can now be indexed by the tool.
Logging to JSON
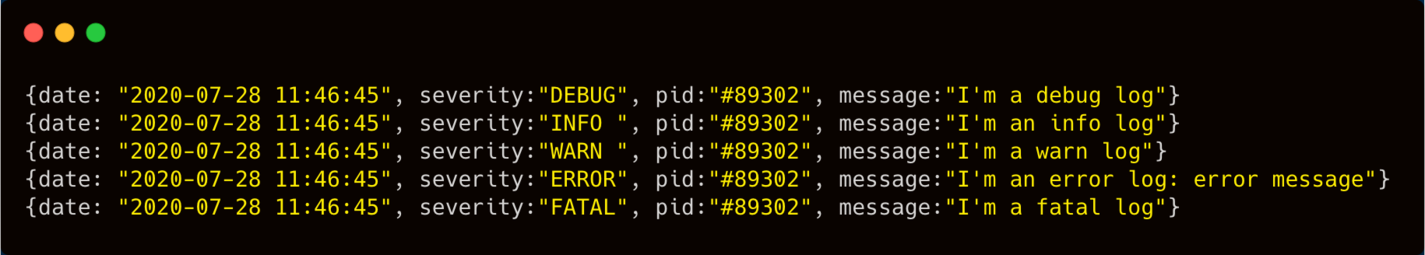
With the power of Formatter in hand, it’s easy to customize your logs to whatever output type you want. For example, we could use the JSON module to output our logs in that format.
require "json"
logger.formatter = proc do |severity, datetime, progname, msg|
    date_format = datetime.strftime("%Y-%m-%d %H:%M:%S")
    JSON.dump(date: "#{date_format}", severity:"#{severity.ljust(5)}", pid:"##{Process.pid}", message: msg) + "\n"
end
And, here are the resulting logs:
Logging to a File
As seen before, the Logger constructor receives, as the first argument, the place where the log should be stored.
If you want to save your logs to a file, just say so:
require 'logger'
logger = Logger.new('my_logs.log')
This will create a new file my_logs.log in the same folder where your Ruby file containing this code is located:
However, the class also allows a bunch of custom options, such as a retention policy config. Take the following example:
# Keep data for the current week.
Logger.new('my_weekly_logs.log', 'weekly')
# Keep data for today and the past 2 months.
Logger.new('my_latest_2_months_logs.log', 2, 'monthly')
# Restarts the log over when it exceeds 26GB in size.
Logger.new('my_custom_logs.log', 0, 20 * 1024 * 1024 * 1024)
As a second param, Logger accepts a definition of how frequently it should keep the logs or erase them.
In the first object, the logs will be kept for one week only. The second will store them for a range of two months, while the latest will analyze just the size of the file (e.g., whenever it reaches 20GB, it’ll be discarded) based on the third param.
Logging in Ruby on Rails
Most of the benefits of Logger we’ve seen so far can all be used along with Rails apps. The Rails version of Logger is just a simple extension of Ruby’s native class.
Apart from that, Rails also adds a nice feature to allow devs to broadcast their logs to multiple loggers. Thus, if you want to work with more than one logging library, you can do so within Rails logger:
custom_logger = Logger.new(STDOUT)
Rails.logger.extend(ActiveSupport::Logger.broadcast(custom_logger))
This can also be useful when you need some intelligence regarding the places your logs should go. Some parts of your app may need logs in different locations or different formats.
Choosing a Third-party Logging Framework
If Ruby's built-in logger doesn't do exactly what you need, you have options.
There are plenty of options when it comes to picking up a 3rd-party logging framework. The most popular of these is Lograge. Let's take a look at it!
First Steps with Lograge
Lograge was made for Rails apps. If you’re working with vanilla Ruby, it may not be a good choice.
To install it, just add the following gem:
bundle add lograge
Then, create a new config file at config/initializers/lograge.rb with the following code:
Rails.application.configure do
    config.lograge.enabled = true
    config.lograge.custom_options = lambda do |event|
        { time: event.time }
    end
end
This config enables Lograge and defines the time that a log, considered an event to the framework, has to be printed.
When you start the Rails app and access the first endpoint, Lograge will print the request summary. Comparing the logs before and after Lograge setup, respectively, results in something like shown below:
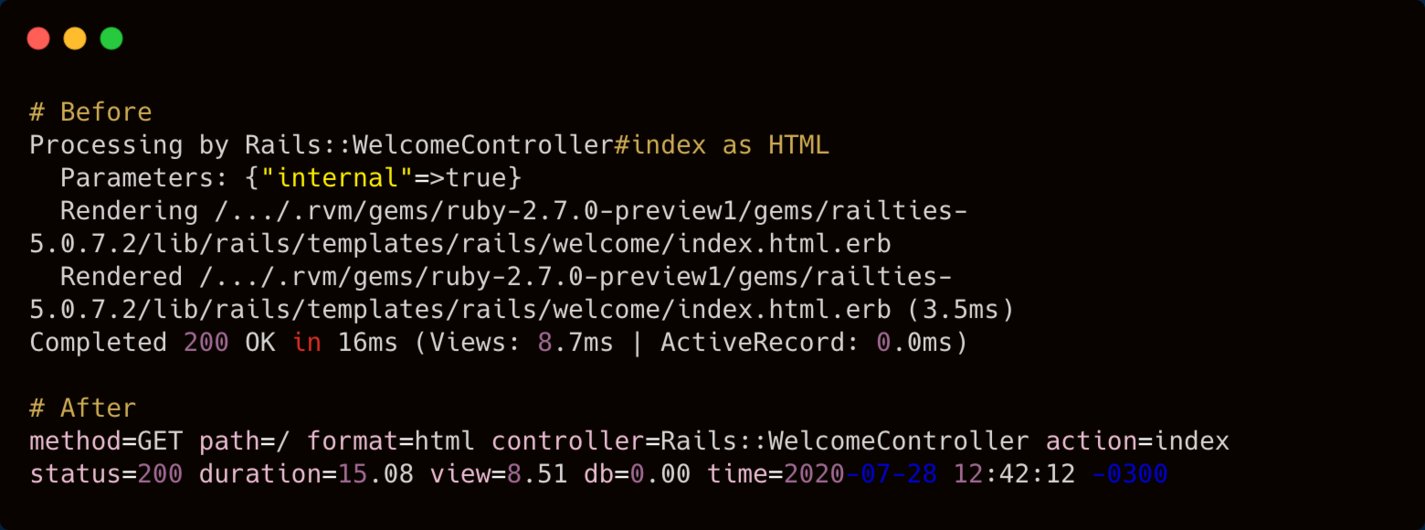
Again, Lograge is not a silver bullet; it is actually a very opinionated framework. So, you’ll probably need to use it along with the built-in Logger (or other frameworks of your preference).
Wrapping Up
In the end, it becomes clearer that logging is not only a crucial part of your projects but also very underestimated. To better understand the tools you’re using, regardless of whether they are native, will help you to achieve better results too.
Be sure to always conduct a lot of testing to adopting a new framework. Sometimes your platform already comes bundled with great built-in options. If that’s not the case, determine whether it allows the use of other frameworks integrated with the one that’s already inside.
Best of luck!


 Molly Struve, Sr. Site Reliability Engineer, Netflix
